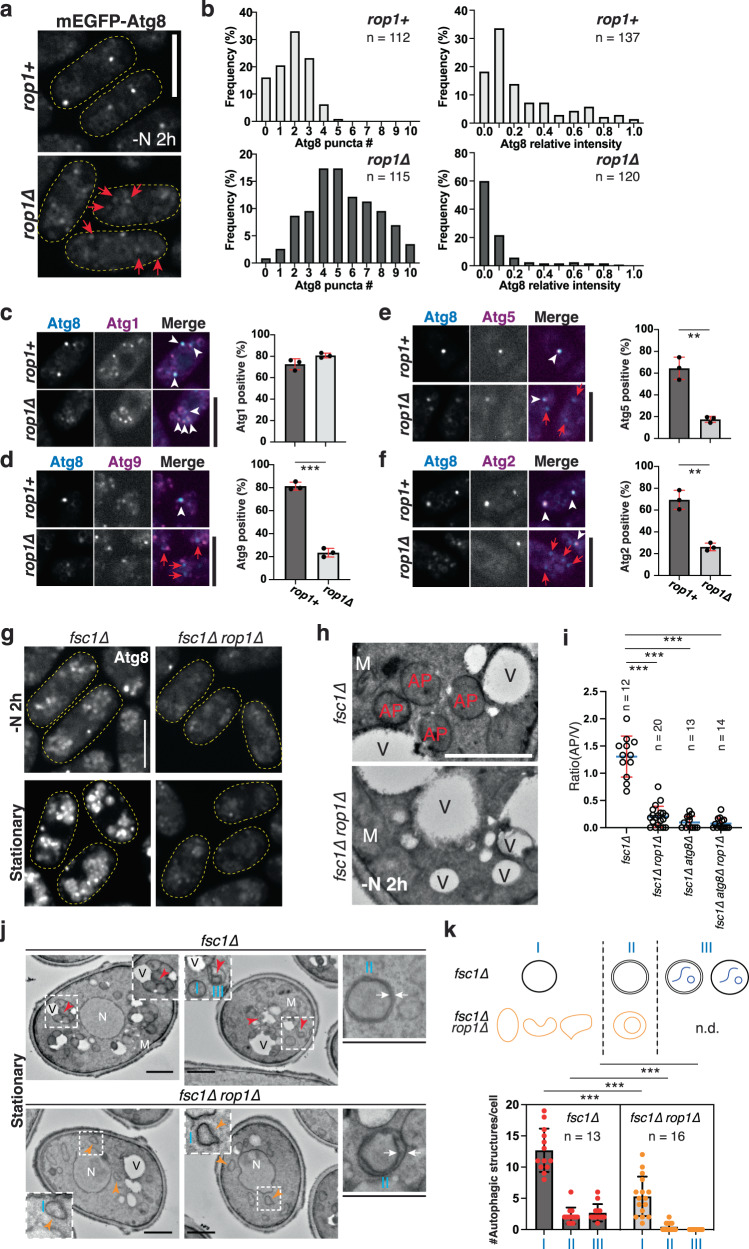
Fig. 3. Rop1 is required for autophagosome formation.
a Atg8 was tagged with mEGFP (mEGFP-Atg8) and expressed at endogenous levels in rop1+ or rop1∆ cells. Cells were imaged after 2 h of nitrogen starvation (-N 2 h). The boundaries of cells are indicated by dashed lines. Dim Atg8 punctae in rop1∆ cells are indicated by red arrows. Scale bar, 5 µm. b Number of mEGFP-Atg8 punctae per cell (left) and their intensity (right), expressed relative to the brightest Atg8 punctum in rop1+ cells (right). n, number of analyzed cells (left) or punctae (right). c tdTomato-tagged Atg1 was visualized together with mEGFP-Atg8 in rop1+ or rop1∆ cells after 2 h of nitrogen starvation. The right panel shows quantification of three experiments (mean and SD). Scale bar, 5 µm. d As in (c), but with tdTomato-tagged Atg9. *** indicates a significant difference with p-value 4.1 × 10⁻⁵, calculated from two-tailed Student’s t tests. e As in (c), but with tdTomato-tagged Atg5. p-value: 0.0015. f As in (c), but with tdTomato-tagged Atg2. p-value: 0.0014. g As in (a), but with fsc1∆ or fsc1∆ rop1∆ cells. The cells were nitrogen-starved for 2 h or in stationary growth phase. h fsc1∆ or fsc1∆ rop1∆ cells were starved for 2 h and analyzed by TEM. M mitochondrion, V vacuole, AP autophagosome. Scale bar, 500 nm. i Ratio of number of autophagosomes to vacuoles per section of a cell, determined in an experiment as in (h). Cells lacking Atg8 were also analyzed (for images, see Supplementary Fig. 5e, f). n, number of cells analyzed. Also shown are means and SD. *** indicates significant differences with p-values < 0.001, calculated from two-tailed Student’s t tests. The exact p-values are listed in the Source Data file. j As in (h), but for stationary phase cells. N nucleus. Red arrowheads indicate autophagosomes with enclosed substrate, and orange arrowheads point to aberrant autophagic structures. White arrows highlight the two membranes of autophagosomes. The regions in the squares are magnified in the insets. Scale bars, 1 µm. k Quantification of autophagic structures in (j), performed as in (i). The scheme shows three categories of structures (I, II, III) counted. n.d., not detected. The dots in the graph give the numbers of individual structures in these categories. The bars show means and SD. n, number of cells analyzed.

