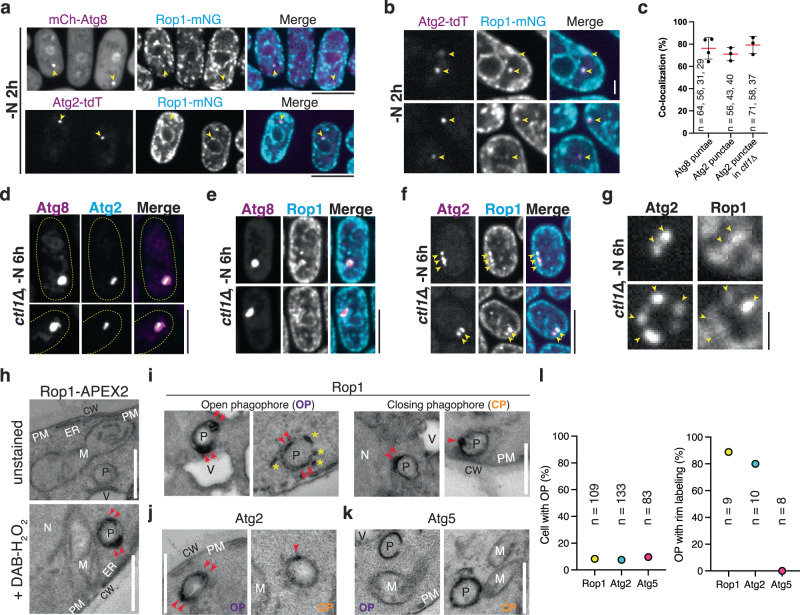
Fig. 6. Rop1 colocalizes with Atg2.
a A fusion of mNeonGreen with Rop1 (Rop1-mNG) was expressed at endogenous levels together with mCherry tagged Atg8 (mCh-Atg8) or tdTomato tagged Atg2 (Atg2-tdT). Cells were imaged after 2 h of nitrogen starvation (-N 2 h). Arrowheads point to punctae where colocalization is observed. Scale bar, 5 µm. b As in (a), but magnified view. Scale Bar, 1 µm. c Percentage of Atg2 or Atg8 punctae containing Rop1 in (a, b, and f). The dots show the colocalization determined in three or four experiments. n, number of punctae analyzed. Means and SD are shown. d mEGFP-Atg8 and Atg2-tdT were co-expressed at endogenous levels in ctl1Δ cells. Cells were imaged after 6 h of nitrogen starvation. Note that Atg2 localizes to a sub-region of the enlarged phagophores marked by Atg8 (ref. 26). Scale bar, 5 µm. e As in (d), but for mCh-Atg8 and Rop1-mNG. f As in (d), but for Atg2-tdT and Rop1-mNG. Yellow arrowheads highlight co-localization. g As in (f), but a magnified view. Scale bar, 1 µm. h Cells expressing Rop1-APEX2 were nitrogen-starved for 2 h, fixed, stained with diaminobenzidine (DAB) and H2O2, and analyzed by TEM. A fixed sample without DAB-H2O2 treatment (unstained) is shown as a control. P phagophore, CW cell wall, M mitochondrion, N nucleus, PM plasma membrane, V vacuole, ER endoplasmic reticulum. Red arrowheads point to the tips of a C-shaped phagophore. Scale bar, 500 nm. i As in (h), except that closing phagophores (CP) are shown on the right. Asterisks point to small vesicles or short tubules near the open phagophore (OP). j As in (h), but with Atg2-APEX2. k As in (h), but with Atg5-APEX2. l Quantification of the experiments in (h–k). The left panel shows the percentage of cell sections containing OPs. The right panel shows the percentage of OPs with rim labeling.

