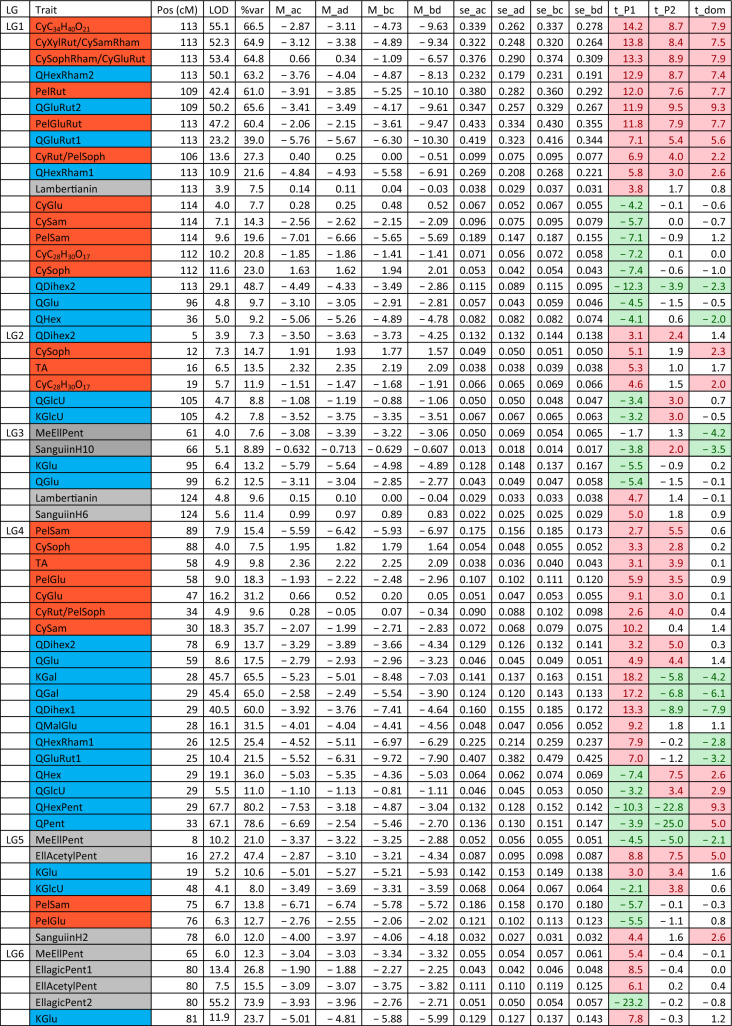
Table 3.
QTLs detected for each metabolite. This is based on the average values for each genotype over the three years
Pos is the position of the maximum LOD, %var is the %variance explained by that QTL. M_ac, M_ad, M_bc and M_bd are the estimated means for offspring genotypes ac, ad, bc and bd respectively and se_ac etc.are the corresponding standard errors. t_P1 is a t-test for the significance of the Latham additive effect, t_P2 is a t-test for the Glen Moy additive effect and t_dom for the dominance effect. The significant effects are shaded red if they are positive or green if they are negative. Anthocyanin components are shaded in red, flavonols in blue, with ellagitannins and ellagic acid derivatives in grey

