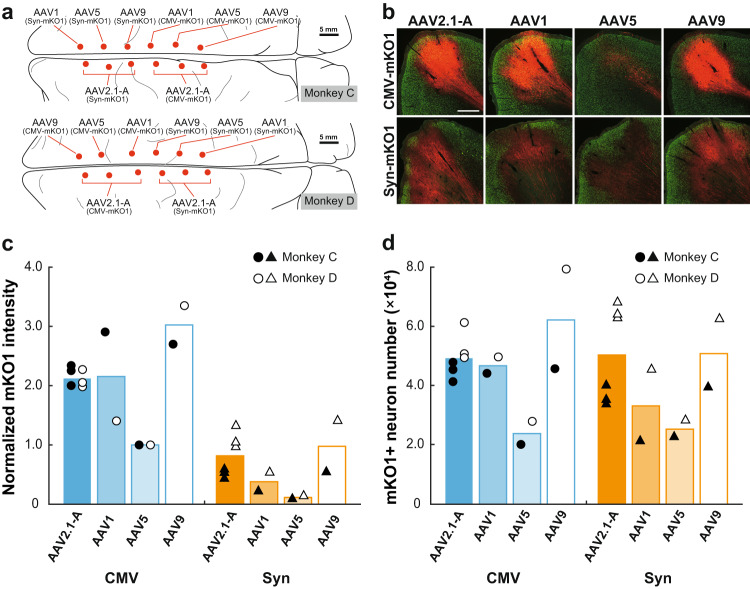
Fig. 3. Intensity of mKO1 native-fluorescence and number of mKO1-positive neurons at sites of monkey cortical injections of AAV2.1-A, AAV1, AAV5, and AAV9 vectors.
a Schematic diagrams showing the injection loci of eight distinct types of recombinant AAV vectors carrying the mKO1 gene in the medial wall of the frontal lobe in Monkey C (upper) and Monkey D (lower). The sites of cortical injections of the AAV2.1-A vector were placed symmetrically to those of the other vectors in the opposite hemisphere. Scale bars, 5 mm. b mKO1 native-fluorescence (red) and NeuN immunofluorescence (green) at each vector injection site. Representative images are taken from Monkey C. Similar images were also obtained in Monkey D. Scale bar, 1 mm. c Comparison of mKO1 native-fluorescence intensity within a 2-mm-diameter circular observation window. Data are expressed as the averaged value obtained in Monkeys C (filled symbols) and D (open symbols), relative to the mean for the AAV5-CMV vector defined as 1.0. d Comparison of mKO1-positive neuron number obtained from stereological cell counts. The cell counts were done over the whole transgene-expressing region in each section. See the Methods for the details of fluorescence intensity and cell-count analyses. n = 2 biologically independent animals. Source data are provided as a Source data file.

