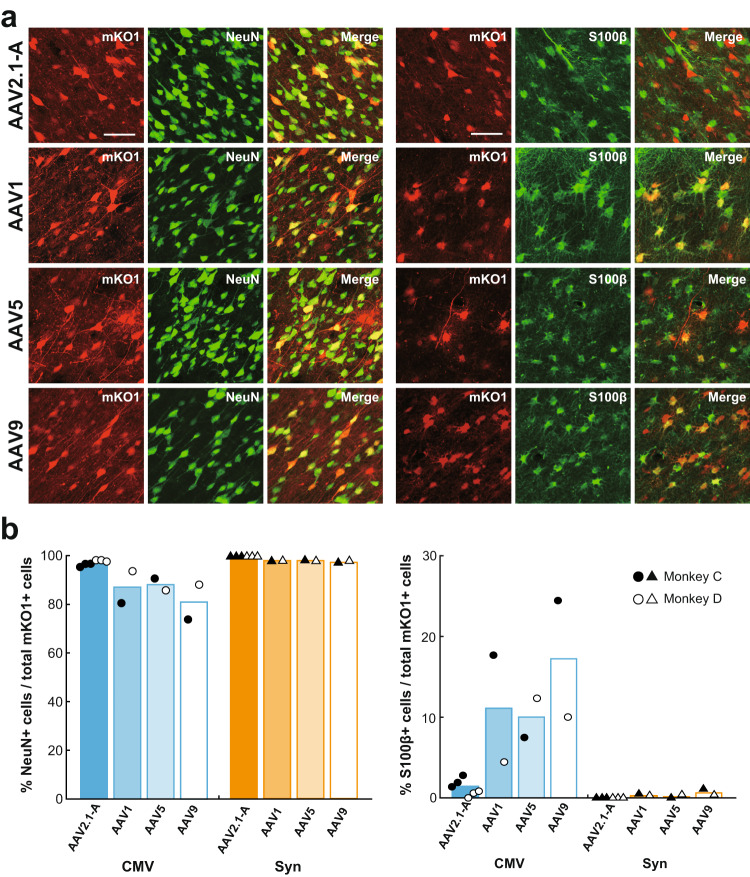
Fig. 4. Transgene expression in neurons and glial cells at injection sites of AAV2.1-A, AAV1, AAV5, and AAV9 vectors.
a Double fluorescence histochemistry for mKO1 native-fluorescence (red) and immunofluorescence for NeuN (green; left) or S100β (green; right) at the injection sites of AAV vectors inserted with CMV promoter. Shown are representative images obtained in Monkey C. In each case, double-labeled cells are denoted in yellow (Merge). Representative images are taken from Monkey C. Similar images were also obtained in Monkey D. Scale bars, 50 μm. b Ratios of cells double-labeled for NeuN (left) or S100β (right) to the total mKO1-positive cells at each vector injection site. Each ratio was determined as the mean of data obtained in three sections examined, including the section through the center of the injection site. n = 2 biologically independent animals, and n = 6 independent injections for the AAV2.1-A vector. Source data are provided as a Source data file.

