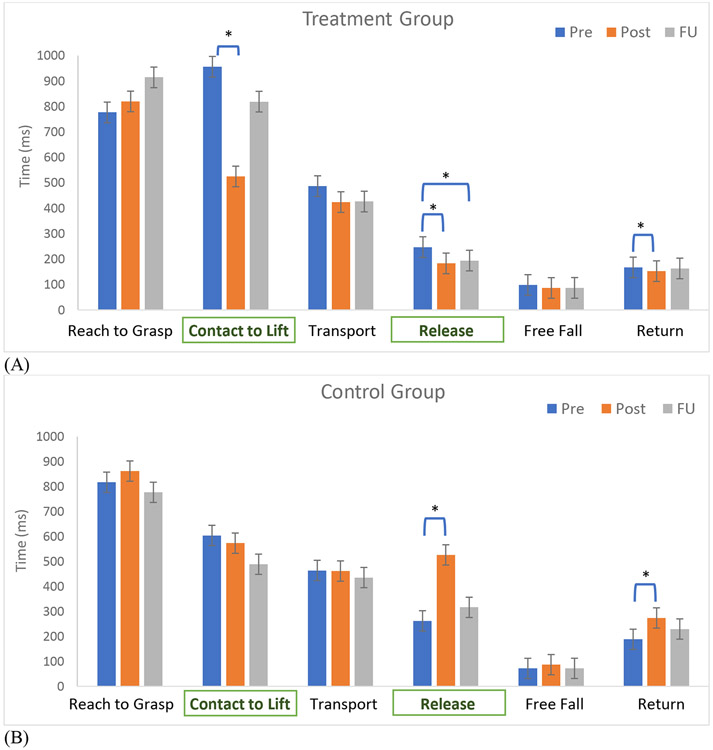
Figure 3.
Movement time for each component at 3 timepoints (pre, post, and follow-up) for the treatment group (A) and control group (B). Error bars show standard errors. Asterisks denote significant changes based on pairwise comparisons with Tukey post hoc adjustment. Movement components for grasp are in bold in rectangles (Contact to Lift and Release), while those for reach are not.

