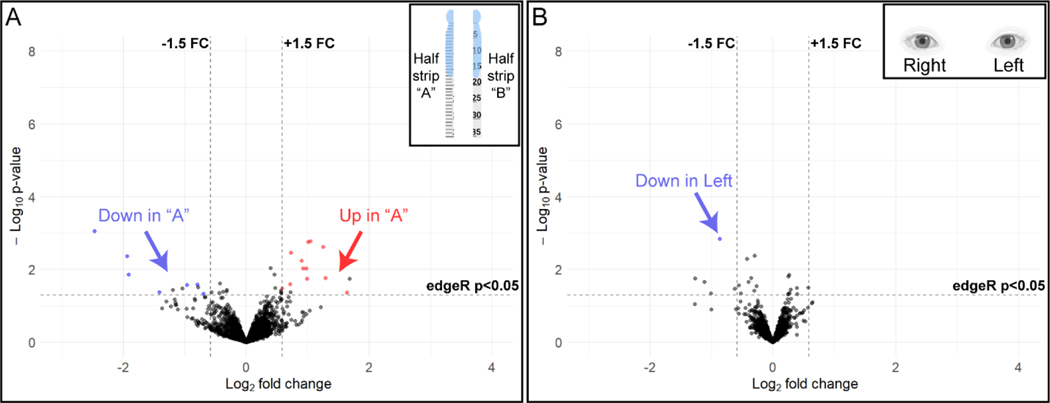
Figure 3.
Volcano plots of relative protein abundance in (A) replicates of strips cut in half (n = 7 eyes, 2 half-strips/eye, 14 half strips, inset) and (B) left and right eyes of the same individual (n = 4 people, 8 eyes, inset). X-axis values are the log2 fold changes (FC) and y-axis values are the log10 uncorrected edgeR exact test p-values. There were very few proteins that demonstrated an increase (red) or decrease (blue) in relative abundance in (A) half strip “A” as compared to half strip “B”. There was only 1 protein in the left eye (B) that demonstrated decreased (blue) relative abundance when compared to the right eye of the same participant. A complete list of differentially expressed proteins in the above comparisons can be found in Appendix Tables A.1 and A.2. Insets created with BioRender.com

