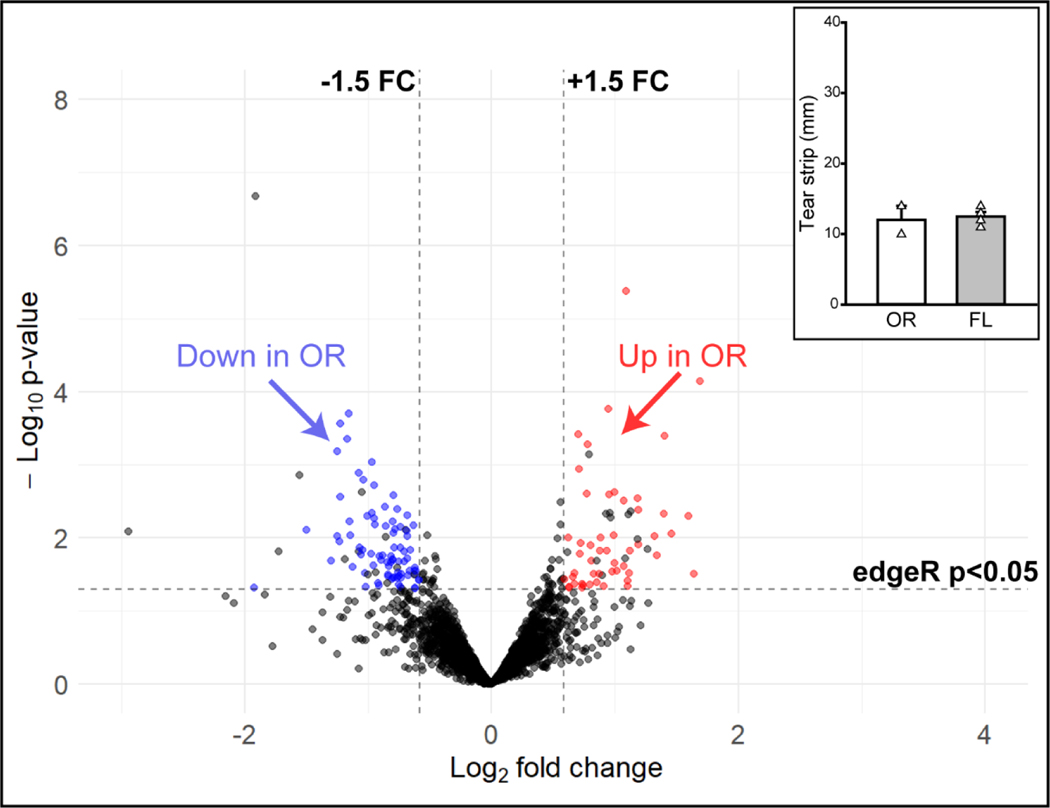
Figure 6.
Volcano plot of differentially abundant proteins by tear collection site. Oregon (OR) samples demonstrate differential abundance of proteins as compared to Florida (FL) samples. Inset is a graph of Schirmer strip wetted lengths from OR and FL samples included in this comparison. Even when Schirmer strip wetted length was controlled, there were proteins that were increased (red) or decreased (blue) in relative abundance in OR samples as compared to FL samples. There was one protein that exceeded the standardized scales set for these volcano plots and is not shown. A complete list of differentially expressed proteins in the above comparisons can be found in Appendix Table A.5. Inset: Mean tear strip length ± SEM. White triangles represent individual sample values within each group.

