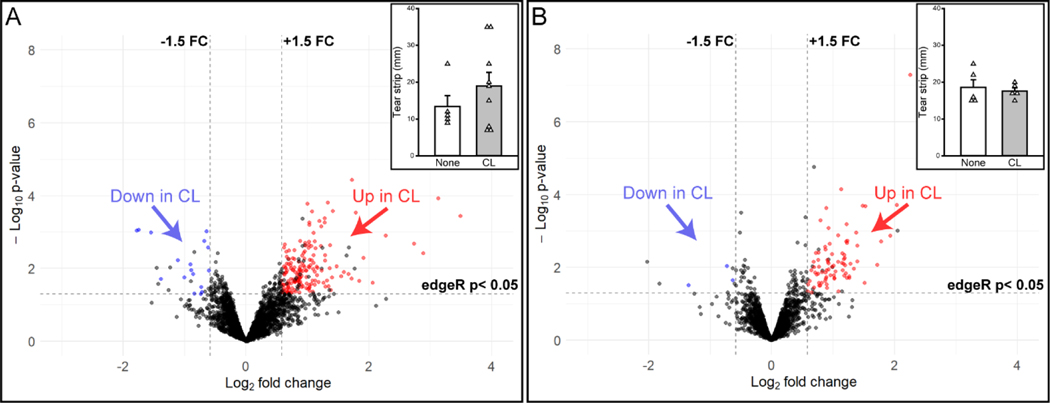
Figure 7.
Volcano plots of differentially abundant proteins with soft contact lens (CL) use for (A) individuals with a wide range of Schirmer strip wetted length or (B) individuals with more restricted Schirmer length. Both panels depict the number of proteins that increase (red) or decrease (blue) in relative abundance in CL users as compared to those participants who do not use CLs. One protein exceeded the standardized scales and was not shown in the figure (A). Insets are Schirmer strip wetted lengths from CL users (CL, gray bar) and those who do not use CLs (None, white bar) for each experiment. A complete list of differentially expressed proteins in the above comparisons can be found in Appendix Tables A.6 and A.7. Insets: Mean tear strip lengths ± SEM. White triangles represent individual sample values within each group.

