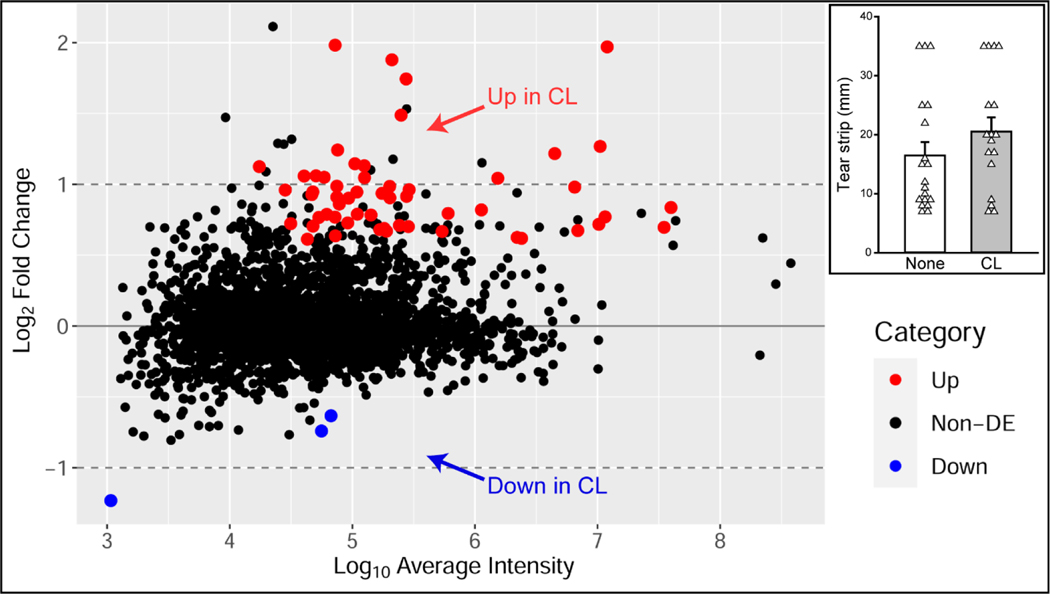
Figure 8.
Visual representation of the 2596 total proteins detected in the combined contact lens (CL) analysis of differentially abundant proteins in CL users as compared to CL non-users. Proteins that met criteria for differential abundance are color-coded by those that had increased (red) and decreased (blue) abundance in CL users. Proteins that were not differentially expressed (Non-DE) between the two groups are shown in black. Inset: Schirmer tear strip wetted lengths are balanced between the CL group (CL, gray bar) and non-user group (None, white bar) with a wide variation in strip lengths. Inset: Bars indicate mean strip lengths ± SEM. White triangles represent individual sample values within each group.

