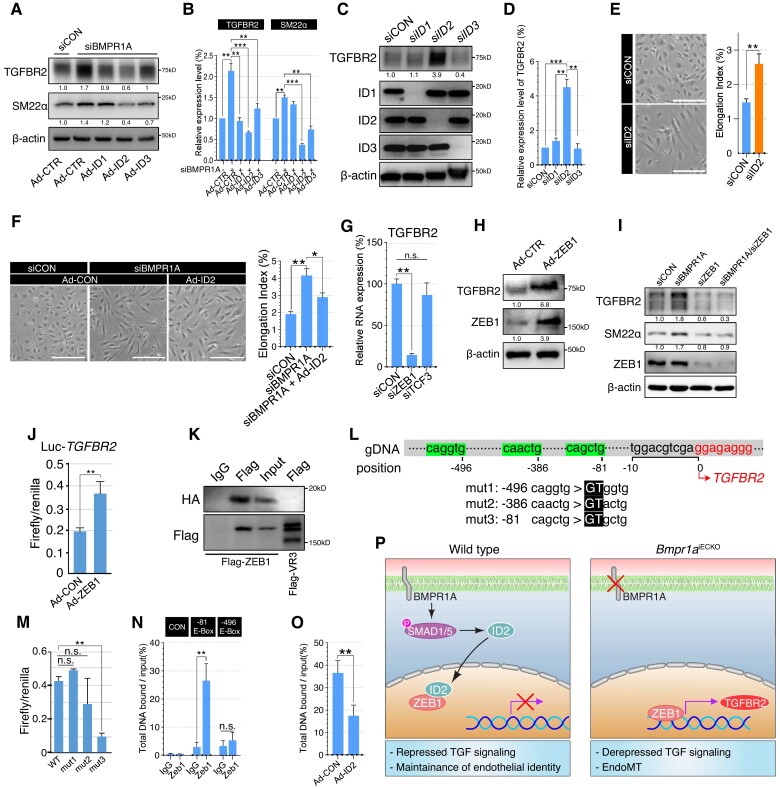
Figure 4.
ID2–ZEB1 interactions regulate transcription of TGFBR2. (A) Western blots showing TGFBR2 and SM22α expression in control or BMPR1A siRNA-treated PAEC cells with control, ID1, ID2, or ID3 overexpressing adenovirus infection. Note that ID2-overexpressed PAECs showed dramatic reduction of TGFBR2 expression. (B) Quantification of TGFBR2 and SM22α protein expression in C [**P ≤ 0.005 (unpaired t-test), n = 3]. (C) Western blots showing TGFBR2 expression in control, ID1, ID2, or ID3 siRNA-treated PAECs. Expression of TGFBR2 was significantly increased in ID2 siRNA-treated cells, but not in ID1 or ID3 siRNA. (D) Quantification of TGFBR2 protein expression in control, ID1, ID2, or ID3 siRNA-treated PAECs [***P < 0.0001, **P ≤ 0.005 (unpaired t-test), n = 3]. (E) Representative images showing the morphology of control or ID2 siRNA-treated PAECs (scale bar = 50 μm). Right panel shows quantification of elongation index [**P ≤ 0.005 (unpaired t-test), n = 27]. (F) Representative images showing the morphology of control or BMPR1A siRNA-treated PAECs with control or ID2 adenoviral overexpression (scale bar = 50 μm). Right panel shows quantification of elongation index [**P ≤ 0.005, *P ≤ 0.05 (unpaired t-test), n = 36]. (G) Quantification of TGFBR2 RNA expression in control, ZEB1 or TCF3 siRNA-treated PAECs. [**P ≤ 0.005 (unpaired t-test), n = 3]. (H) Western blots showing TGFBR2 expression in control or ZEB1 overexpressing PAECs. Overexpression of ZEB1 induces robust expression of TGFBR2 in PAECs. (I) Western blots showing the expression of TGFBR2, SM22α, and ZEB1 and BMPR1A in control, BMPR1A, ZEB1, or BMPR1A/ZEB1 siRNA-treated PAECs. Inhibiting ZEB1 effectively suppressed the ectopic expression of TGFBR2 and SM22α induced by BMPR1A siRNA treatment. (J) Luciferase assay using pGL4-luciferase reporter vector containing the TGFBR2 promoter region (−1670/+36) with control or ZEB1 overexpressing PAECs [**P ≤ 0.005 (unpaired t-test), n = 3]. (K) Co-immunoprecipitation using Flag-ZEB1 and HA-ID2-overexpressing PAECs showing that ID2 could physically interact with ZEB1. Flag-VEGFR3 infected cells were used as negative control for flag antibody. (L) Display of genomic sequence corresponding to the 5′-upstream and transcription initiation site (font) of TGFBR2. Three putative E-box motifs located at −496, −386, and −81 positions from the TGFBR2 transcription initiation site were highlighted. The mutated sequence with site-directed mutagenesis in pGL4- TGFBR2 promoter was highlighted in black box. (M) Luciferase assay using pGL4-basic Luc vector containing control, mut1, mut2, or mut3 TGFBR2 promoter region with ZEB1 overexpressing HEK293 cells. Note that an E-box motif at the −81 position within the TGFBR2 promoter confers ZEB1-mediated regulation of TGFBR2 expression [**P ≤ 0.005 (unpaired t-test), n = 3]. (N) Chromatin immunoprecipitation showing the interaction between ZEB1 and the E-box motif at the −81 position/−496 position within the TGFBR2 promoter or Lif (negative control). Note that only the E-box motif at the −81 position was pulled down with Flag-ZEB1-binding antibody [**P ≤ 0.005 (unpaired t-test), n = 3]. (O) Chromatin immunoprecipitation showing that ID2 overexpression inhibits the binding of ZEB1 to the TGFBR2 promoter (E-box motif at the −81 position) [**P ≤ 0.005 (unpaired t-test), n = 3]. (P) Our working model: In the presence of endothelial BMPR1A, ID2–ZEB1 interaction increases. We speculate that ID2 could prevent ZEB1 from binding to the promoter of TGFBR2, and inducing transcription by sequestering ZEB1, which helps effectively maintain endothelial fate (left). In Bmpr1aiECKO mice, lack of BMPR1A and ID2 allows ZEB1 to bind to the promoter of TGFBR2, and derepresses its expression, which leads to the loss of endothelial identity and EndoMT.

