Figure 1.
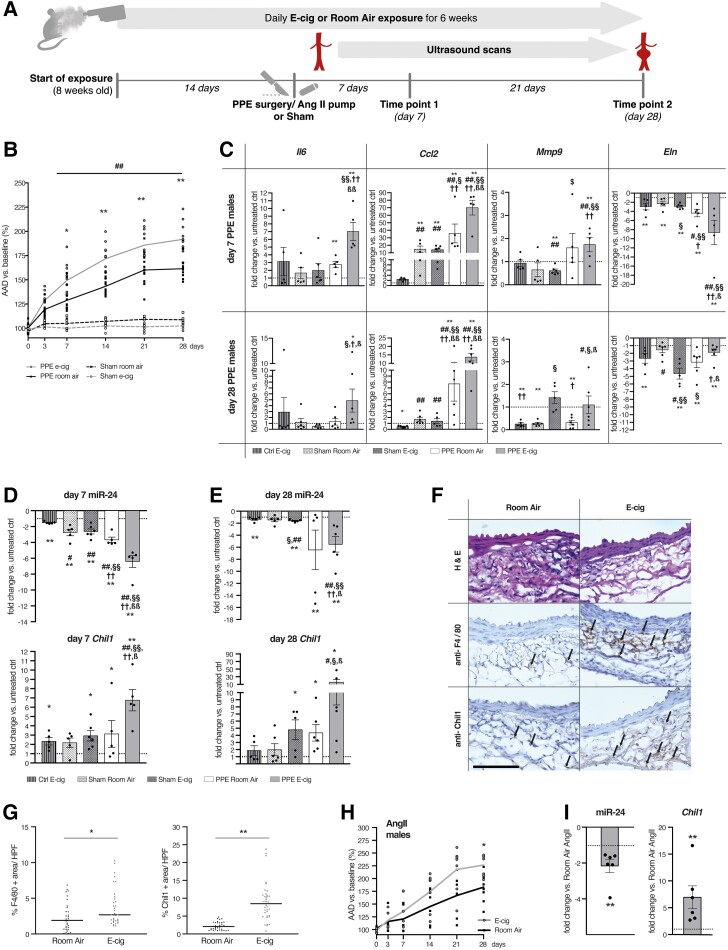
AAA progression and gene expression, miR-24, and Chil1 response to E-cig exposure during AAA development. (A) Schematic timeline of E-cig vaping experiments. Aortic ultrasound scans were performed at baseline, at day 3 and day 7 after AAA induction, and then weekly. (B) Daily exposure to E-cig in male C57BL/6J mice containing nicotine (24 mg/mL, 9 s puffs per minute, 60 min/d) increased AAA diameter by ultrasound vs. Room air-exposed control animals after PPE and vs. sham surgery with or without E-cig (n = 5-13 per group). Sham surgery did not lead to aortic dilation in E-cig or room air-exposed animals. (C) Gene expression of key inflammatory markers (Il6, Ccl2) and ECM-related genes (Mmp9, Eln) (n = 5–6 per group) in males at day 7 (top) and day 28 (bottom) in aortic tissue derived from untreated animals, or after sham or PPE surgery with or without E-cig exposure. (D and E) Gene expression of miR-24 and its target Chil1 in the same tissues as in C quantified by qRT–PCR at day 7 (D left) and 28 (E right) (n = 5–6 per group). (F) Aortic aneurysm sections from male animals were harvested after 28 days and stained with hematoxylin and eosin, and IHC was used for anti-F4/80 and anti-Chil1. Positive areas were quantified. Scale bar is 100 µm. Arrows indicate positively stained areas. (G) IHC of F4/80- (top) and Chil1- (bottom) positive areas were quantified in high power fields (HPF) (4 HPF per slide, 3 slides per animal, 3 AAA per group). (H) Male ApoE−/− mice were exposed to E-cig according to the same protocol as used in A. After 2 weeks of pre-exposure to E-cig or Room-air, osmotic minipumps filled with Ang-II were implanted and suprarenal aortic growth was measured via ultrasound (n = 8 per group). (I) miR-24 and Chil1 gene expression levels in AAA tissues from E-cig-exposed (vs. Room-air-exposed, Ang-II-treated-) ApoE−/− mice using qRT–PCR at Day 28 after pump implantation (n = 5–6 per group). Graphs (B and H) show aortic aneurysm diameter (AAD) % increase vs. baseline. *P < 0.05; **P < 0.01 AAA E-cig vs. AAA room air. ##P < 0.01 both PPE groups vs. both sham surgery groups. All by two-way ANOVA with multiple comparison (B and H). Gene expression data are presented as fold change (FC) vs. unoperated, room air-exposed control. *P < 0.05 or **P < 0.01 vs. Sham; #P < 0.05 or ##P < 0.01 vs. unoperated, e-cig-exposed control; §P < 0.05 or §§P < 0.01 vs. sham-operated, room air-exposed control; †P < 0.05 or ††P < 0.01 vs. sham-operated, e-cig-exposed control; ßP < 0.05 or ßßP < 0.01 vs. PPE-operated, room air-exposed. Two tailed student’s t-test (C, D, E, and I). *P < 0.05; **P < 0.01 Two tailed student’s t-test (G) Data are mean ± SEM. Down-regulated genes are shown as −1/FC.

