Figure 1.
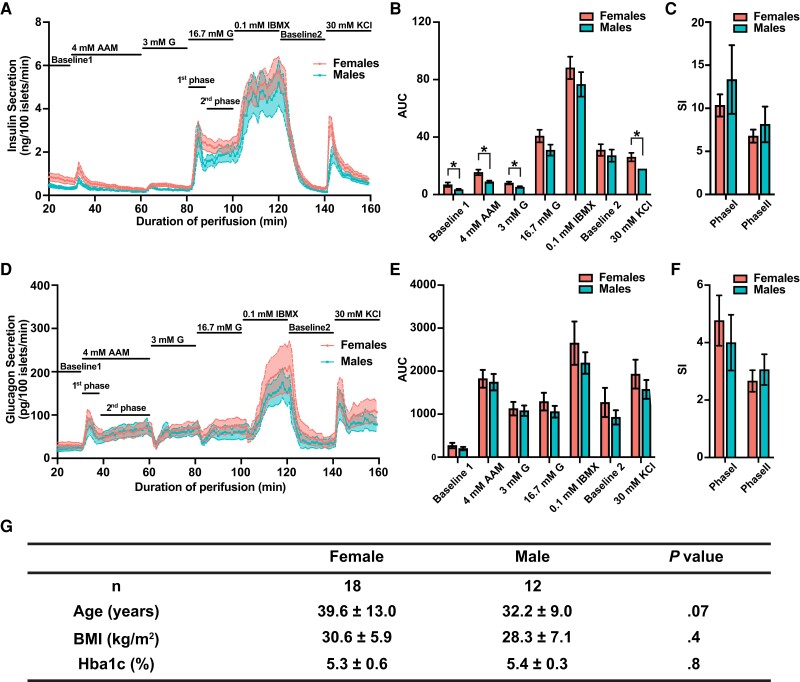
Sex differences in human islet functional responses in adult control donors. A, Insulin perifusion data from control women and control men. Solid lines indicate data average, with female data shown in pink and male data shown in blue. Shaded areas represent SEs of the distribution. Conditions include Baseline1 (no stimuli), 4 mM AAM (4 mM amino acid mixture [AAM]), 3 mM G (4 mM AAM + 3 mM glucose [G]), 16.7 mM G (4 mM AAM + 16.7 mM glucose), 0.1 mM IBMX (4 mM AAM + 16.7 mM Glucose + 0.1 mM isobutylmethylxanthine [IBMX], Baseline2 [no stimuli], and 30 mM KCl (30 mM potassium chloride [KCl]). B, Quantification of area under the curve (AUC) in insulin secretion in each of the stimulus conditions. Error bar indicates ± SE. Differences between women and men in AUC were tested by unpaired t test. *False discovery rate less than 0.1. C, Quantification of stimulation indices (SIs) for the first and second phase of insulin secretion. Differences between women and men were tested by unpaired t test. No statistically significant difference is observed. D, Glucagon perifusion data from the same donors as shown in A. E, Quantification of AUC in glucagon secretion in each of the stimulus conditions. F, SIs for the first and second phase of glucagon secretion. Differences between women and men were tested by unpaired t test. No statistically significant difference is observed. G, Donor characteristics. Data are shown as mean ± SD. P values are based on Mann-Whitney U test.

