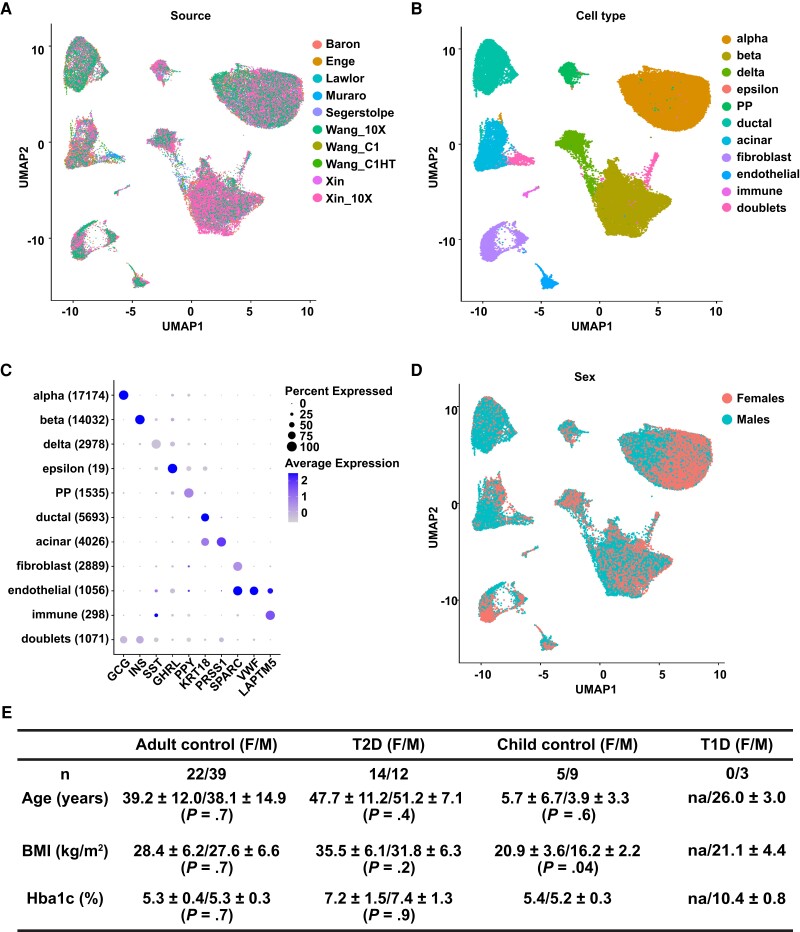
Figure 2.
Integration of single-cell RNA sequencing (RNA-seq) data from 10 studies. A, Uniform Manifold Approximation and Projection (UMAP) embedding with cells colored according to study source. B, UMAP embedding with cells colored according to cell type. C, Dot plot illustrating how the expression of marker genes changes across different cell types. The size of the dot represents the percentage of cells that express the marker genes, while the color represents the average expression level of the marker genes across all cells within the same cell type. The number of cells in each cell type is shown inside parentheses. D, UMAP embedding with cells colored according to sex. E, Summary demographic information of donors in each category in the integrated single-cell RNA-seq data. P values are based on Mann-Whitney U test. na, not applicable.

