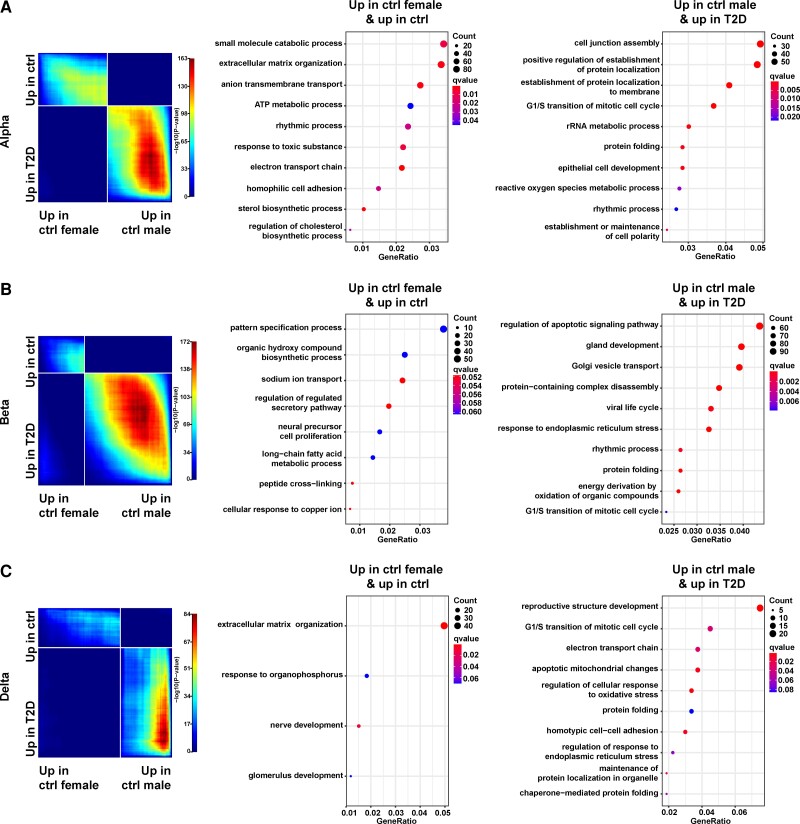
Figure 5.
Male controls have gene expression patterns similar to type 2 diabetes (T2D). A, Results are shown for alpha cells. Left, rank-rank hypergeometric overlap (RRHO) analysis comparing 2 gene lists containing the differentially expressed genes from female controls vs male controls (x axis) and the differentially expressed genes from T2D vs controls (y axis). White strips represent the transition points in the directions of differential expression in the corresponding gene list. Middle, dot plot displaying the gene ontology (GO) terms related to genes located in the upper left quadrant of RRHO plot. These genes are up in female controls (compared with male controls) and up in controls (compared with T2D). Representative GO terms were selected based on superclusters from REVIGO (32). Right, dot plot displaying the GO terms related to genes located in the lower right quadrant of RRHO plot. These genes are up in male controls (compared with female controls) and up in T2D (compared with controls). B, Same layout as A except that the results are shown for beta cells. C, Same layout as A except that the results are shown for delta cells.

