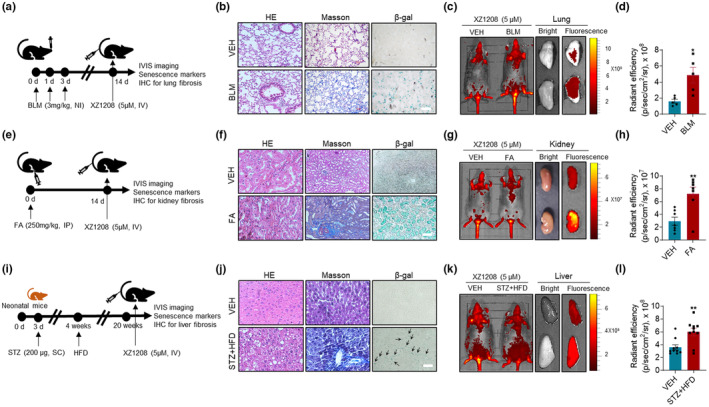
FIGURE 5.

Effective labeling of SnCs by XZ1208 in fibrosis mouse models. (a–d) Lung fibrosis was induced by administering mice with 3 mg/kg BLM via nasal inhalation, followed by Masson and β‐Gal staining of the lung. Mice and lungs were imaged and quantified for fluorescence intensity (n = 5 mice for each group). (e–h) Kidney fibrosis was induced by administering mice with a single dose of 250 mg/kg folic acid intraperitoneally, followed by Masson and β‐Gal staining of the kidney. Mice and kidneys were imaged and quantified for fluorescence intensity (n = 7 mice for each group). (i–l) Liver fibrosis was induced by injecting neonatal mice subcutaneously with 200 μg of STZ, followed by a HFD. Liver fibrosis was validated by Masson staining and SnC accumulation was indicated by β‐Gal staining. Mice and livers were imaged and quantified for fluorescence intensity (n = 10 mice for each group I). Scale bars, 100 μm (for b) and 200 μm (for f and j). Black arrows indicate positive β‐Gal staining. Data are mean ± SEM. Data were analyzed by two‐sided Student's t‐test. *p < 0.05, **p < 0.01, ***p < 0.001, and ****p < 0.0001 compared to vehicle (VEH) group.
