
FIGURE 4.
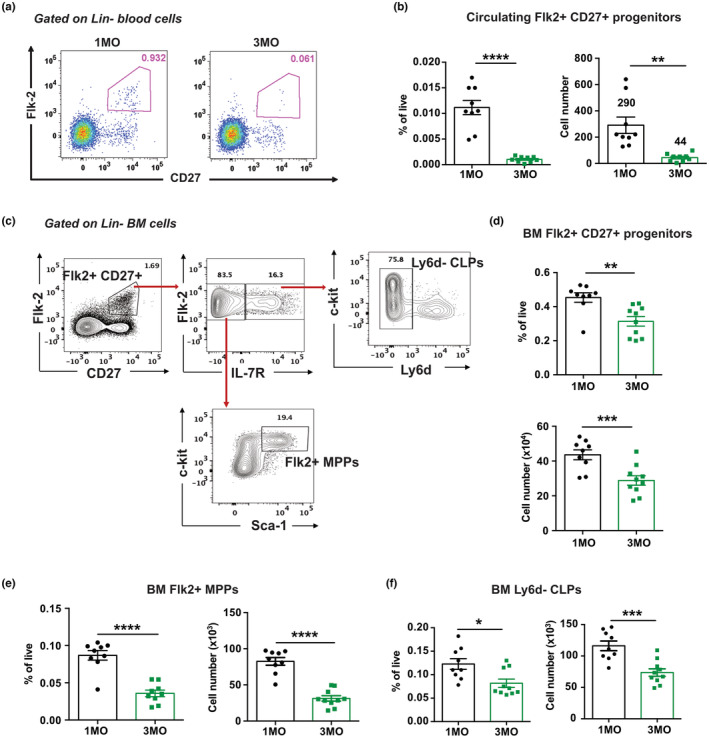
The number of circulating TSPs and BM lymphoid progenitors declines between 1MO and 3MO of age. (a) Representative flow cytometry plots showing the percentage of Flk2+CD27+ progenitors within the Lin− compartment of the blood in 1MO and 3MO mice. (b) Frequency and absolute cell numbers of circulating lymphoid progenitors in total blood of 1MO and 3MO mice. (c) Representative gating strategy for quantification of Lin−Flk2+CD27+ progenitors, Ly6d− common lymphoid progenitors (CLPs), and Flk2+ multipotent progenitors (MPPs) in the BM. (d–f) Frequency and absolute numbers of (d) Flk2+CD27+ progenitors, (e) Flk2+ MPPs and (f) Ly6d− CLPs in BM of 1MO and 3MO mice. Symbols represent data from individual mice at each age. Bars represent means ± SEM of data compiled from three independent experiments (n = 9 mice per age group). Statistical analysis was performed using Student t test, *p < 0.05, **p < 0.01, ***p < 0.001, ****p < 0.0001.