
FIGURE 6.
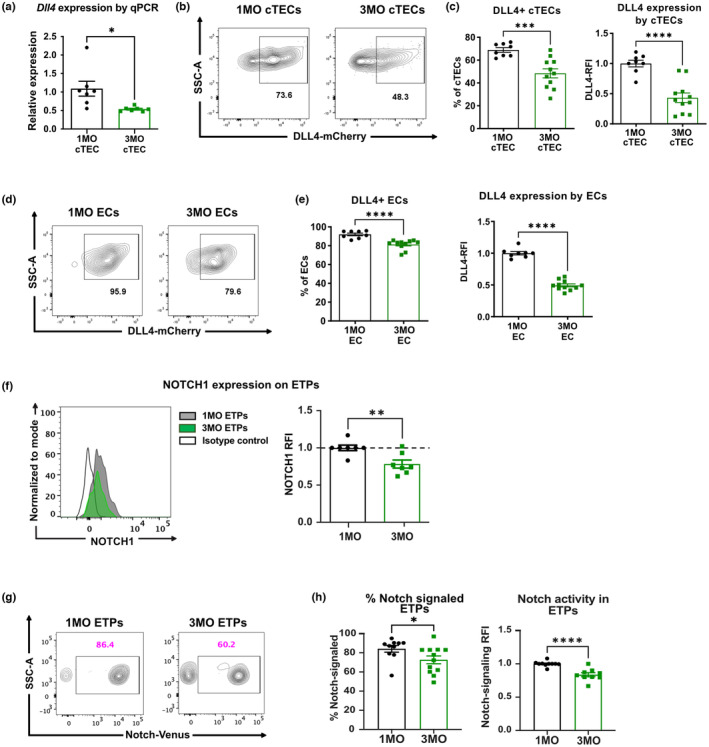
Age‐associated changes in Notch ligand expression and Notch signaling in the thymus correlate with the decline in ETPs at 3MO. (a) qPCR analysis showing relative Dll4 expression by CD45− EpCAM+ Ly51+ cTECs from 1MO and 3MO C57BL/6J mice. Data are pooled from two biological experiments with 3–4 technical replicates per experiment, and expression levels were normalized to those at 1MO of age. (b, d) Representative flow cytometry plots and (c, e) quantification of the frequency of Dll4‐reporter+ cells and Dll4‐mCherry RFIs in (b, c) CD45− EpCAM+ Ly51+ cTECs, and (d, e) CD45− CD31+ endothelial cells (ECs) from Dll4‐mCherry reporter mice. Data are normalized to the average Dll4‐mCherry expression by (c) 1MO cTECs and (e) 1MO ECs. (c, e) Data are pooled from four independent experiments (n = 8–10 mice). (f) Representative histogram (left) and quantification of RFIs (right) of NOTCH1 cell surface expression on thymic ETPs. Data are normalized to the average NOTCH1 MFI of 1MO mice in each individual experiment. Data are pooled from three independent experiments (n = 7 mice per age group). (g) Representative flow cytometry plots and (h) frequencies and RFIs of Notch‐Venus reporter expression in thymic ETPs. Data are pooled from five independent experiments (n = 9–12 mice per age group). (c, e, f, h) Symbols represent data from individual mice at each age and bars represent means ± SEM. Statistical analysis was performed using Student t test, *p < 0.05, **p < 0.01, ***p < 0.001, ****p < 0.0001.