FIGURE 6.

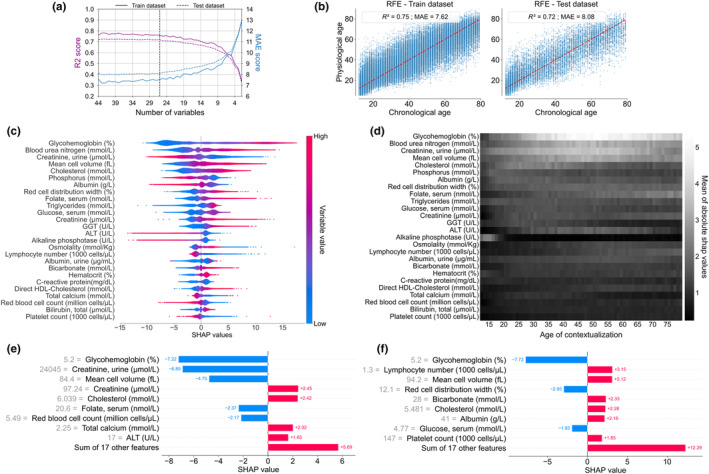
Generation of a minimal model to estimate physiological age (RFE model). (a) Evolution of XGBoost custom loss model performance (R 2 and MAE scores) through recursive feature elimination (RFE). A model with 26 variables seems sufficient without significantly altering the model performance. Global explainability of the PPA model. (b) Graphical representation of the predicted physiological age defined by the RFE model (based on XGBoost with Custom loss) as a function of chronological age, on the train and test datasets. The red line indicates situations where physiological age is identical to chronological age. (c) Global explanation of the RFE model with the mean of absolute SHAP values in order of importance. Each point color encodes the SHAP value of each variable for each individual, red and blue colors for high and low values of the variable, respectively. On the x‐axis, a positive or negative SHAP value means that the variable for one individual contributes to a positive or negative estimation of physiological age relative to chronological age. (d) Heatmap of the mean of the absolute contextualized SHAP values for each variable (the whiter the color, the higher the mean absolute SHAP value) for each chronological age. (e, f) For a given individual, a personalized and contextualized explanation of physiological age wan be given. To the base value (mean predicted age of the individuals of the same chronological age), several contributions of each variable contextualized SHAP value were added to obtain the physiological age (increase of PPA in red, decrease of PPA in blue). (e) Example of an individual of 61 y.o predicted 49, (f) and an individual of 64 y.o. predicted 76.
