
FIGURE 2.
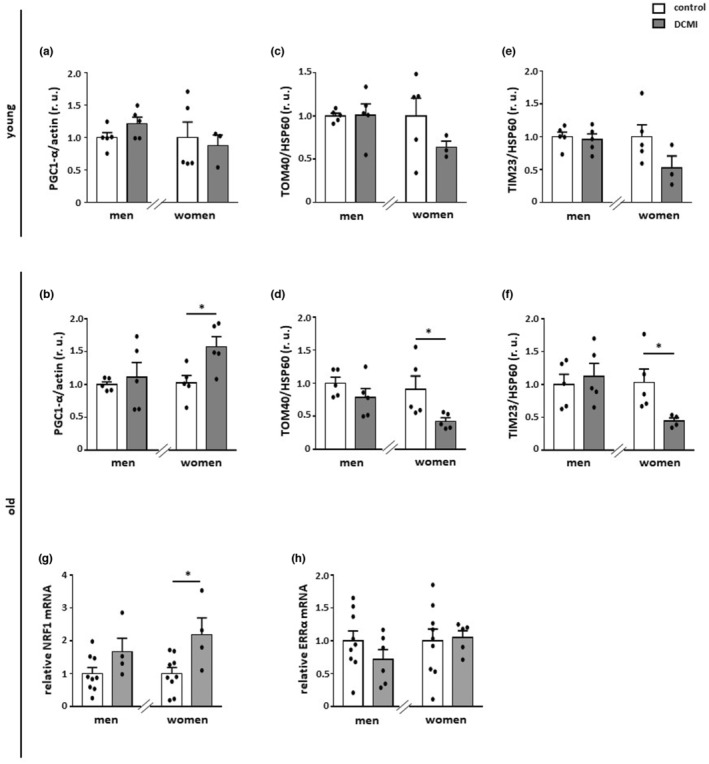
Alterations in the expression of PGC‐1α and mitochondrial proteins. Statistics from western blot expression analysis of (a and b) PGC‐1α, (c and d) TOM40, and (e and f) TIM23, performed with lysates of cardiac tissue from diseased and non‐diseased, younger and older men and women. (g and h) Relative mRNA expression of NRF1 and ERRα in diseased and non‐diseased cardiac tissue in older men and women. Data are shown as the means ± SEM (n = 3‐9/group). Mann–Whitney Test; *p < 0.05 versus corresponding control. All data were normalized to the corresponding control and expressed in relative units (r.u.).