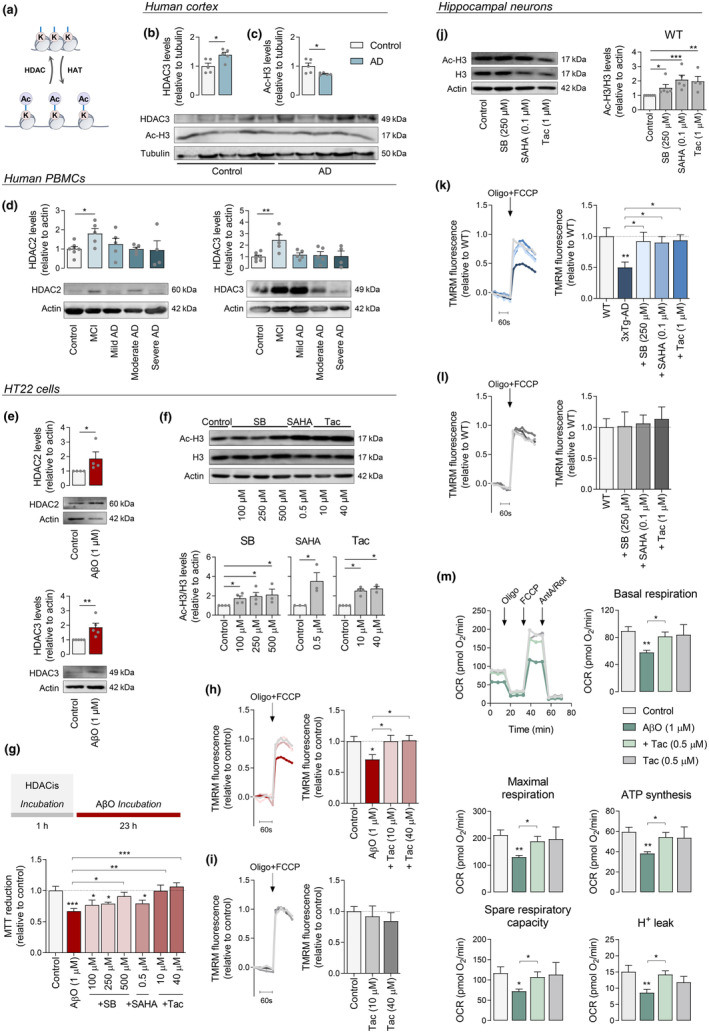
FIGURE 1.

Levels of HDAC2 and HDAC3 and effect of HDACis on acetyl‐H3 levels, AβO‐induced toxicity, and mitochondrial function. Scheme of histone acetylation/deacetylation (a) Western blotting analysis of HDAC3 (b) and acetyl‐H3 (c) protein levels in postmortem brain cortex derived from control individuals or AD patients. Data are the mean ± SEM of 5 individuals per group. Western blotting analysis of HDAC2 and HDAC3 protein levels in PBMCS derived from control individuals, MCI or AD patients. Data are the mean ± SEM of 4–10 individuals per group (d). HT22 cells were treated for 23 h with 1 μM AβO. Western blotting analysis of HDAC2 and HDAC3 protein levels (e). Cells were treated for 24 h with HDACis (SB, SAHA and Tac at the indicated concentrations). Western blotting analysis of acetyl‐H3 protein levels (f). Cells were pre‐exposed for 1 h with HDACis and then co‐treated with 1 μM AβO for the remaining 23 h of incubation. Cell metabolic activity was measured using the MTT assay (g). Representative TMRM+ fluorescence trace and peak amplitude after oligo plus FCCP stimulation in the presence (h) or absence (i) of AβO. Hippocampal neurons were treated for 24 h with HDACis (250 μM SB; 0.1 μM SAHA or 1 μM Tac). Western blotting analysis of acetyl‐H3 protein levels (j). Representative TMRM+ fluorescence trace and peak amplitude in response to maximal mitochondrial depolarization induced by oligo plus FCCP (2 μg/mL; 2 μM) in 3xTg‐AD (k) and WT (l) neurons. WT hippocampal neurons were pre‐treated for 1 h with Tac (0.5 μM) and then co‐incubated with 1 μM AβO for the remaining 23 h. Basal respiration, maximal respiration, ATP production (oligomycin‐sensitive respiration), spare respiratory capacity, and H+ leak were quantified using a Seahorse analyzer (m). HT22 cells (f–i) were pre‐treated for 1 h with Tac (10 or 40 μM) and then co‐incubated with 1 μM AβO for the remaining 23 h. Representative F340/380 fluorescence trace and peak amplitude after oligo plus FCCP stimulation in the presence (h) or absence (i) of AβO. Data are the mean ± SEM of 3–7 independent experiments, run in triplicates to quadruplicates. Statistical analysis: Kruskal–Wallis followed by uncorrected Dunn's multiple comparison test, one‐way ANOVA followed by uncorrected Fisher's LSD multiple comparison test, Mann–Whitney test and unpaired Student's t‐test; *p < 0.05; **p < 0.01; ***p < 0.001 when compared to the control.
