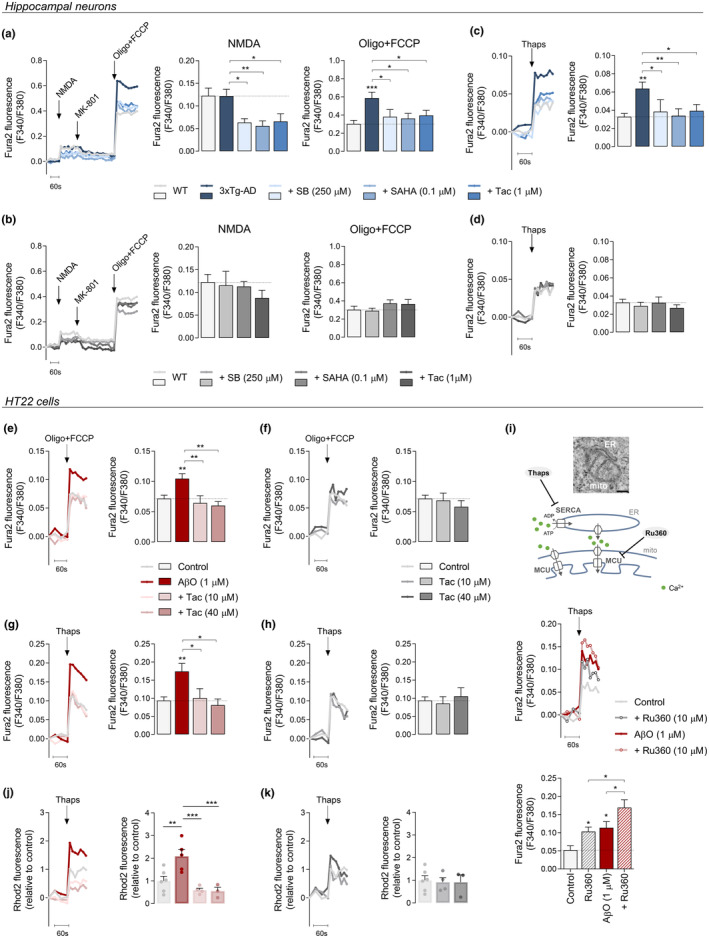
FIGURE 2.

Effect of HDACis on ER‐mitochondria Ca2+ transfer in hippocampal neurons and AβO‐treated cells. Hippocampal neurons (a–d) were treated for 24 h with HDACis (250 μM SB; 0.1 μM SAHA or 1 μM Tac). Representative F340/380 fluorescence trace and peak amplitude in response to 100 μM NMDA stimulation and to maximal mitochondrial depolarization induced by oligo plus FCCP (2 μg/mL; 2 μM) in 3xTg‐AD (a) and WT (b) neurons following HDACis pre‐treatment. Representative F340/380 fluorescence trace and peak amplitude in response to ER‐Ca2+ storage depletion induced by thapsigargin (1 μM) in 3xTg‐AD (c) and WT (d) neurons. HT22 cells (e–k) were pre‐treated for 1 h with Tac (10 or 40 μM) and then co‐incubated with 1 μM AβO for the remaining 23 h. Representative F340/380 fluorescence trace and peak amplitude after oligo plus FCCP stimulation in the presence (e) or absence (f) of AβO. Representative F340/380 fluorescence trace and peak amplitude following thapsigargin stimulus in the presence (g) or absence (h) of AβO. Representative F340/380 fluorescence trace and peak amplitude in response to thapsigargin stimulation following a pre‐incubation with Ru360 (MCU inhibitor; 10 μM) (i). Representative Rhod2 fluorescence trace and peak amplitude after thapsigargin stimulation in the presence (j) or absence (k) of AβO. Data are the mean ± SEM of 3–8 independent experiments, run in triplicates to quadruplicates. Statistical analysis: Kruskal–Wallis followed by uncorrected Dunn's multiple comparison test, one‐way ANOVA followed by uncorrected Fisher's LSD multiple comparison test; *p < 0.05; **p < 0.01; ***p < 0.001 when compared to control.
