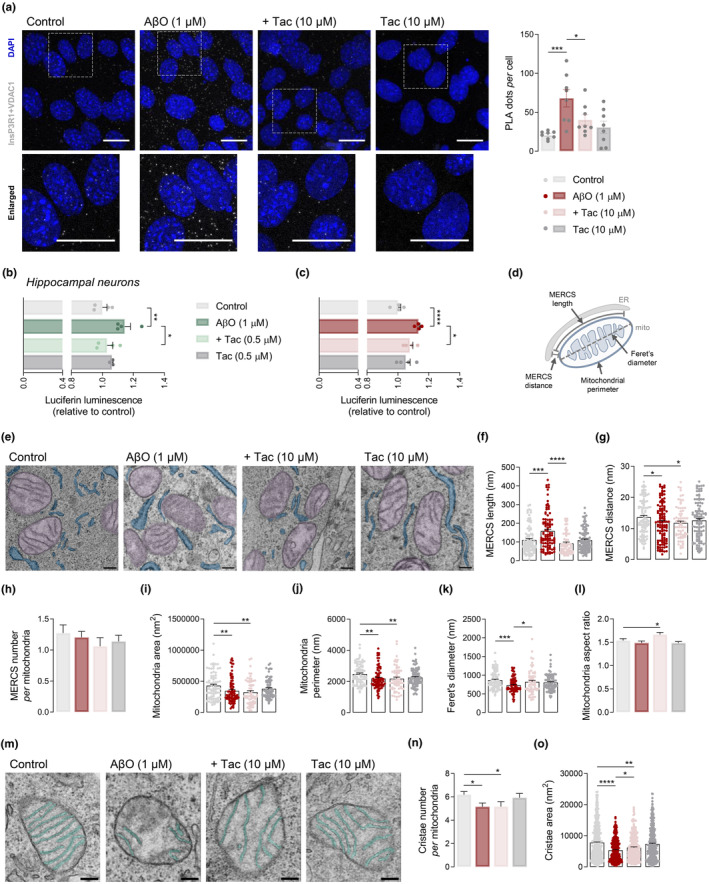
FIGURE 4.

Tac effect on InsP3R1‐VDAC1 interaction and MERCS morphology in AβO‐treated cells. HT22 cells were pre‐treated for 1 h with Tac (10 μM) and then co‐incubated with 1 μM AβO for the remaining 23 h or treated solely with Tac for 24 h. Representative confocal images of in situ PLA signal (gray) indicating a physical interaction between InsP3R1 and VDAC1 (scale bar = 20 μm). The lower panels represent enlargements of the boxed areas in the upper panels. Quantification of number of PLA puncta in about 200–240 cells from 8 image stacks per condition (a). WT hippocampal neurons were pre‐treated for 1 h with Tac (0.5 μM) and then co‐incubated with 1 μM AβO for the remaining 23 h or treated solely with Tac for 24 h. NFAT transcriptional activity evaluated by luciferase reporter assay in hippocampal neurons (b) and HT22 cells (c). Data are the mean ± SEM of 4 independent experiments, run in triplicates to quadruplicates. Schematic representation of MERCS structural parameters: MERCS length and distance, mitochondrial perimeter and Feret's diameter (d). HT22 cells were pre‐treated for 1 h with Tac (10 μM) and then co‐incubated with 1 μM AβO for the remaining 23 h. Representative TEM images of mitochondria (in purple) in close contact with ER (in blue) (scale bar = 200 nm) in which distances ≤25 nm were considered as contacts (e). MERCS length (f) and distance (g), number of MERCS per mitochondria (h), mitochondrial area (i) and perimeter (j), Feret's diameter (k) and mitochondrial aspect ratio (l). Representative TEM images of mitochondrial cristae (in green) (scale bar = 200 nm) (m). Number of cristae per mitochondria (n), and cristae area (o). About 70–90 individual mitochondria from 10 randomly selected cells obtained from approximately 30 images were assessed in 26–38 independent TEM images. Statistical analysis: Kruskal–Wallis test followed by uncorrected Dunn's multiple comparisons test, one‐way ANOVA followed by uncorrected Fisher's LSD multiple comparison test; *p < 0.05; **p < 0.01; ***p < 0.0001; ****p < 0.0001 when compared to control.
