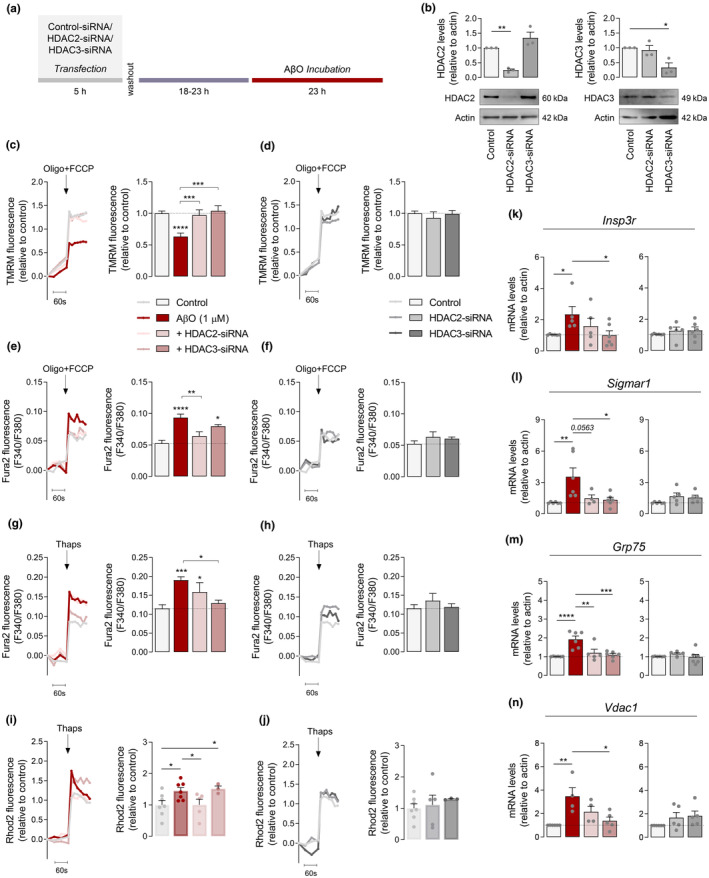
FIGURE 5.

HDAC2/3 knockdown effect on mitochondrial membrane potential, Ca2+ i levels and MAM proteins in AβO‐treated cells. HT22 cells were transfected with either HDAC2‐ or HDAC3‐siRNA. Scrambled siRNA was used as a control. After transfection, cells were treated with 1 μM AβO and incubated for additional 24 h (a). Western blotting analysis of HDAC2 and HDAC3 proteins levels 48 h after transfection with HDAC2‐ or HDAC3‐siRNA (b). Representative trace of TMRM+ fluorescence and peak amplitude relative to control in response to maximal mitochondrial depolarization induced by oligo (2 μg/mL) plus FCCP (2 μM) in the presence (c) or absence (d) of AβO. Representative F340/380 fluorescence trace and peak amplitude after oligo plus FCCP stimulus in the presence (e) or absence (f) of AβO. Representative F340/380 fluorescence trace and peak amplitude in response to ER‐Ca2+ storage depletion induced by thapsigargin in the presence (g), or absence (h) of AβO. Representative Rhod2 fluorescence trace and peak amplitude after thapsigargin stimulation in the presence (i) or absence (j) of AβO. Relative expression of Insp3r (k), Sigmar1 (l), Grp75 (m), and Vdac1 (n) mRNA. Actin was used as the housekeeping messenger and the loading control. Data are the mean ± SEM of 3–7 independent experiments, run in triplicates to quadruplicates. Statistical analysis: Kruskal–Wallis test followed by uncorrected Dunn's multiple comparisons test and one‐way ANOVA followed by uncorrected Fisher's LSD multiple comparison test; *p < 0.05; **p < 0.01; ***p < 0.001; ****p < 0.0001 when compared to control.
