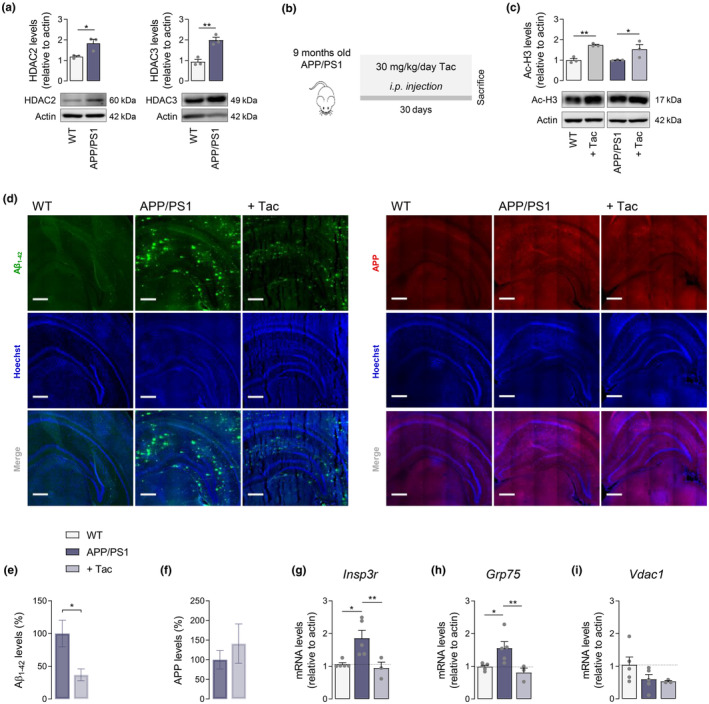
FIGURE 6.

Effect of Tac on Aβ levels and expression of genes involved in ER‐mitochondria Ca2+ communication in the hippocampus of APP/PS1 mice. Western blotting analysis of HDAC2 and HDAC3 protein levels in 10 months old APP/PS1 and WT mice (a). APP/PS1 versus WT mice were treated with Tac (30 mg/kg/day) for 30 days (b). Western blotting analysis of acetyl‐H3 protein levels (c). Representative immunofluorescent images (d; scale bar = 100 μm; 25–30 coronal sections) and quantification of Aβ (e) and APP (f) levels. Relative expression of Insp3r (g), Grp75 (h), and Vdac1 (i) mRNA. Actin was used as the housekeeping messenger and the loading control. Data are the mean ± SEM of 3–5 mice per group. Statistical analysis: Kruskal–Wallis test followed by uncorrected Dunn's multiple comparisons test, one‐way ANOVA followed by uncorrected Fisher's LSD multiple comparison test and unpaired Student's t‐test; *p < 0.05; **p < 0.01 when compared to control.
