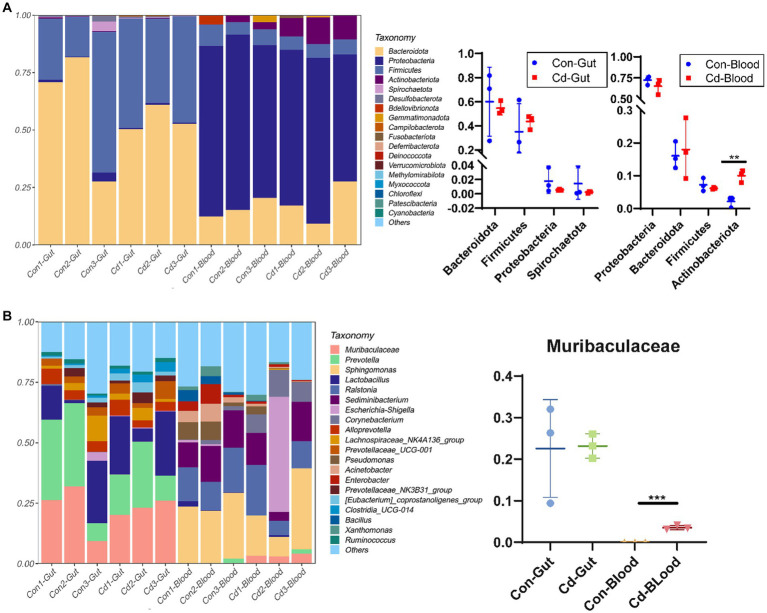
Figure 2.
Relative abundance map of gut and blood microbiome. (A) Bar plot of the relative abundance of species at the phylum level. (B) Bar plot of the relative abundance at the genus level. *Control, Con; CdCl2, Cd. All experimental data are representative of three independent experiments with similar results.

