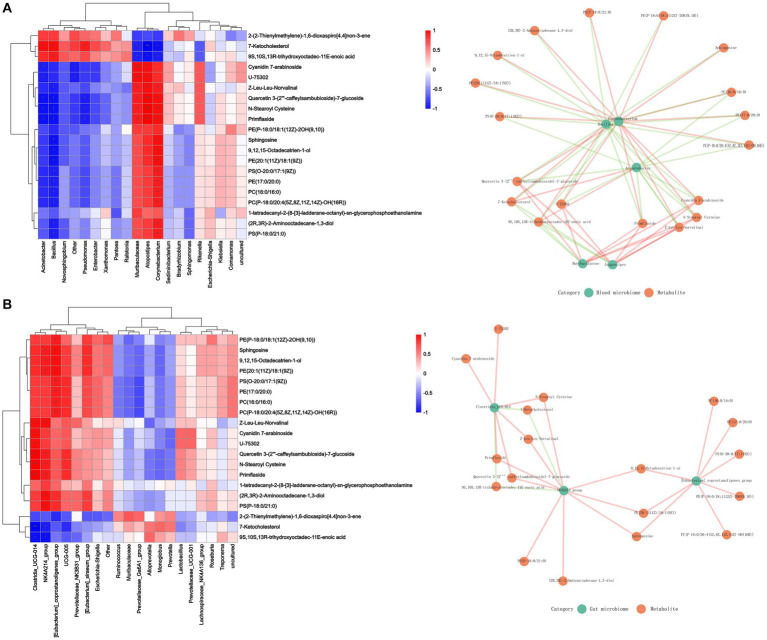
Figure 6.
Effect of Cd exposure on microbial abundance and serum metabolite concentrations. (A) Correlation analysis between blood microbiome and metabolites. (B) Correlation analysis between gut microbiome and metabolites. In the heatmap, red indicates a positive correlation, whereas blue indicates a negative correlation. The darker color, is associated with a higher correlation. The closeness of the color to white represented a correlation closer to zero. ***p < 0.001, **p < 0.01, and *p < 0.05. In the correlation network diagram, green represents microorganisms and orange represents metabolites. The green line indicates a negative correlation, and the orange line indicates a positive correlation.

