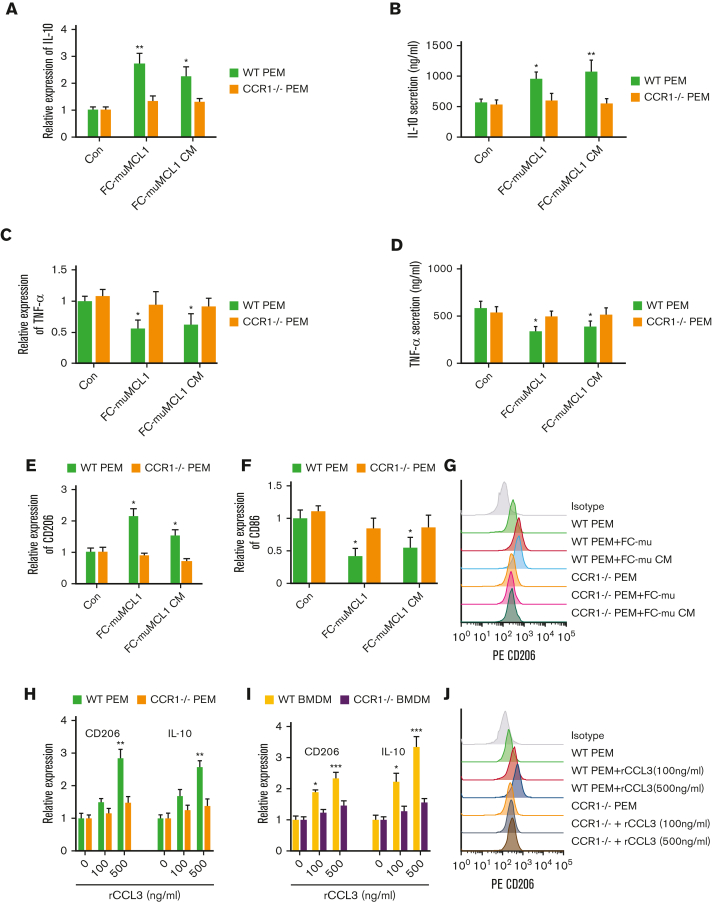
Figure 3.
CCL3-CCR1 axis-mediated macrophage polarization. (A-D) WT or CCR1-/- PEM (n = 3) were cocultured with FC-muMCL1 or incubated with CM collected from FC-muMCL1 for 48 hours, and IL-10 mRNA (A), IL-10 secretion (B), TNF-a mRNA expression (C), and TNF-a secretion (D) in PEM was assessed using qRT-PCR and ELISA, respectively. (E-G) WT or CCR1-/- PEM (n = 3) were cocultured with FC-muMCL1 or incubated with CM collected from FC-muMCL1 for 48 hours; and mRNA levels of CD206 and CD86, and CD206 surface expression were assessed using qRT-PCR and flow cytometry, respectively. (H-I) The mRNA level of CD206 and IL-10 in response to various concentrations of CCL3 was assessed in WT (n = 3) or CCR1-/- (n = 3) PEM (H) or WT and CCR1-/- BMDM (I) using qRT-PCR. (J) WT or CCR1-/- PEM (n = 3) were incubated with exogenous 100 ng/mL or 500 ng/mL CCL3 and CD206 expression was analyzed using flow cytometry. Data presented are representative of 3 independent experiments until or otherwise stated (∗P < .05; ∗∗P < .01).

