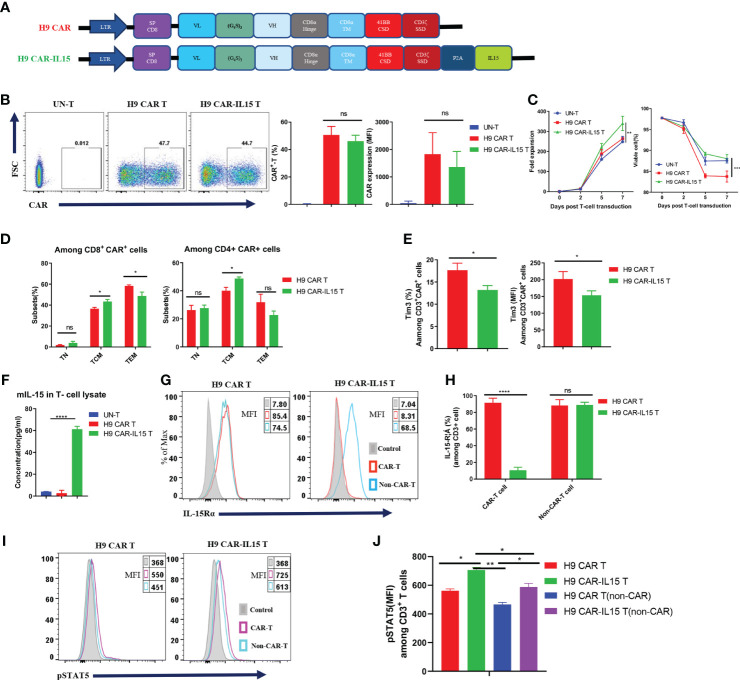
Figure 1.
Generation and characterization of IL-15-expressing anti-CLDN18.2 CAR-T cells. (A) Schematic of retroviral vector constructs encoding H9 CAR or H9 CAR-IL15. (B) Representative flow cytometry plots of CAR expression on Day 7 after transduction (left), mean percentage and MFI of CAR expression pooled from four independent experiments (right). (C) Mean fold expansion of CAR-T cells or percentage of viability over time from four independent experiments. (D) Mean percentage of TN (CD44−CD62L+), TCM (CD44+CD62L+), and TEM (CD44+CD62L-) cells in the CD8 (left) or CD4 (right) subsets pooled from four independent experiments. (E) Mean percentage (left) or MFI (right) of TIM-3 expression in H9 CAR T and H9 CAR-IL15 T cells on Day 7 after transduction pooling from three independent experiments. (F) mIL-15 protein in the lysates of H9 CAR-IL15 T cells determined by ELISA. The results show the mean concentration (pg/ml) ± SD of triplicate wells from one representative of two independent experiments. (G, H) Representative flow cytometry plots (G) and mean percentage (H) of IL15-Rα expression on both CAR-T or non-CAR-T cells of H9 CAR or H9 CAR-IL15 T cells on Day 7 after transduction. Experiments were repeated three times with similar results. (I, J) Representative flow cytometry plots (I) and MFI (H) of IL15-Rα expression on both CAR-T or non-CAR-T cells of H9 CAR or H9 CAR-IL15 T cells on Day 2 after transduction. Experiments were repeated three times with similar results. Statistical analyses were performed using one-way ANOVA with Tukey’s post-hoc correction test (B, F), two-way ANOVA (C), and two-tailed unpaired Student’s t-test (D, E, H, J). Statistical significance was defined as follows: ns, not significant, P > 0.05; *, P < 0.05; **, P < 0.01; ****, P < 0.0001.

