Figure 3.
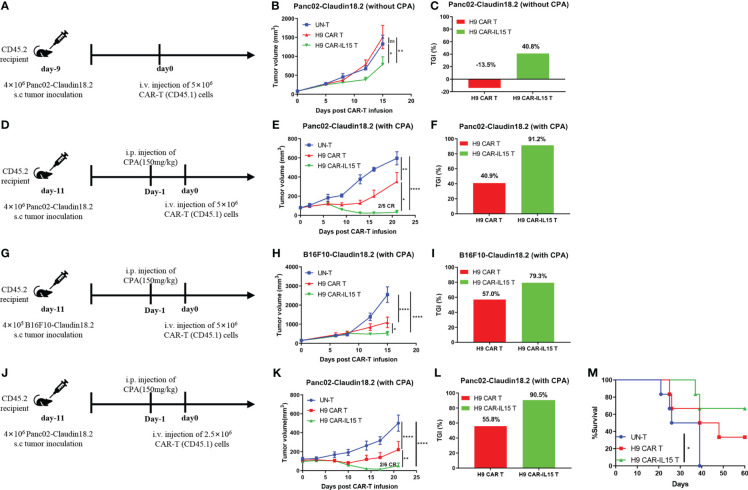
H9 CAR-IL15 T cells exhibit improved antitumor activity in vivo. (A–C) C57BL/6 mice were inoculated s.c. with Panc02-claudin 18.2 cells and treated with CAR-T cells in the absence of CPA pretreatment. (A) Experimental scheme of the in vivo antitumor experiment. (B) Tumor growth was assessed over time, and the results are expressed as the mean tumor volume (mm3 ± SD) with n = 5 mice per group. (C) The tumor growth inhibition in B is shown. (D–F) C57BL/6 mice were inoculated s.c. with Panc02-claudin 18.2 cells and treated with CAR-T cells in the presence of CPA pretreatment. (D) Experimental scheme of the in vivo antitumor experiment. (E) Tumor growth was assessed over time, and the results are expressed as the mean tumor volume (mm3 ± SD) with n = 5 mice per group. (F) The tumor growth inhibition of CAR-T cells in E is shown. (G–I) C57BL/6 mice were inoculated s.c. with B16F10-claudin 18.2 cells and treated with CAR-T cells in the presence of CPA pretreatment. (G) Experimental scheme of the in vivo antitumor experiment. (H) Tumor growth was assessed over time, and the results are expressed as the mean tumor volume (mm3 ± SEM) with n = 5 mice per group. (I) The tumor growth inhibition of CAR-T cells in H is shown. (J–M) C57BL/6 mice were inoculated s.c. with Panc02-claudin 18.2 cells and treated with CAR-T cells in the presence of CPA pretreatment. (J) Experimental scheme of the in vivo antitumor experiment. (K) Tumor growth was assessed over time, and the results are expressed as the mean tumor volume (mm3 ± SEM) with n = 6 mice per group. (L) The tumor growth inhibition in K is shown. (M) Survival of the mice was assessed. Statistical analyses were performed using two-way ANOVA (B, E, H, K). Survival curves were analyzed by using a log-rank test (M). Statistical significance was defined as follows: ns, not significant, P > 0.05; *, P < 0.05; **, P < 0.01; ****, P < 0.0001.

