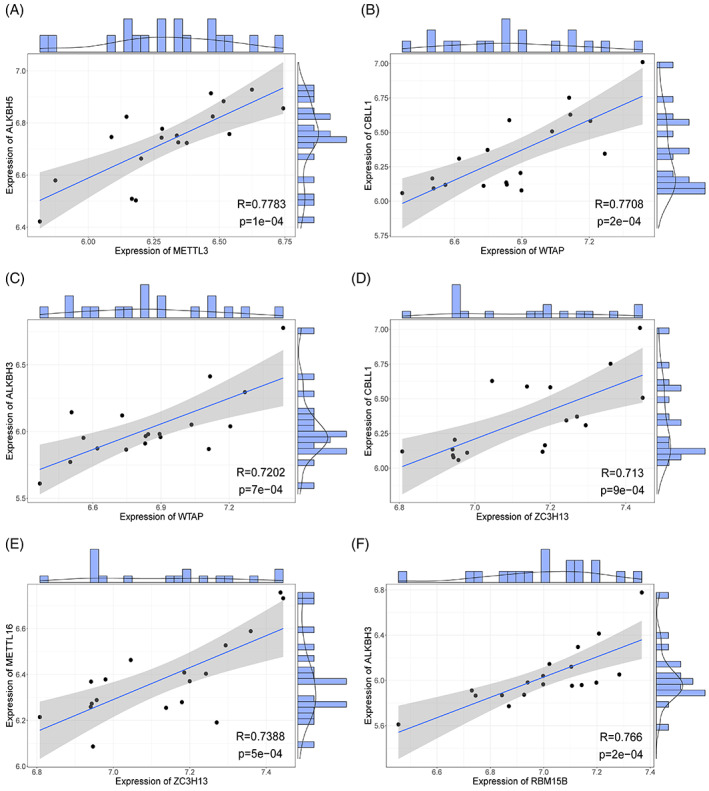
FIGURE 4.

Correlation analysis between writer and eraser m6A genes. Each point in the figure represents a patient sample; the straight line is the correlation fitting curve; the shaded part is the confidence interval; and the area outside the figure are the histogram and density curve. (A) Correlation between METTL3‐ALKBH5. (B) Correlation between WTAP‐CBLL1. (C) Correlation between WTAP‐ALKBH3. (D) Correlation between ZC3H13‐CBLL1. (E) Correlation between ZC3H13‐METTL16. (F) Correlation between RBM15B‐ALKBH3.
