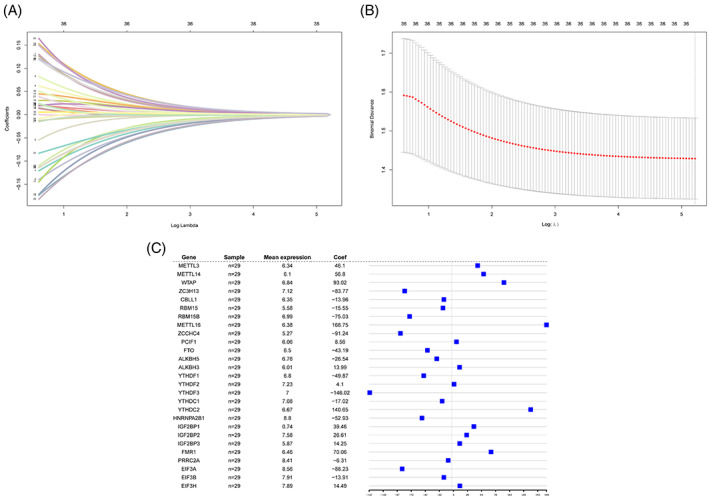
FIGURE 5.

Construction of m6A gene‐based diagnosis model for keloids. (A) Ridge regression curve. This figure shows the convergence screening process of ridge regression for 36 genes. X‐axis is the log lambda value, y‐axis is the regression coefficient, and different coloured lines represent different features. (B) This figure is used to select the best lambda value of the regression model. Usually, the lowest point is selected, that is, the dotted line in the figure is the best lambda value. (C) Forest map of diagnostic model. The first, second, third, and fourth columns and corresponding graphs of the fourth column present the 27 genes that make up the model, number of samples, and average expression value of these genes, and influence coefficients of these genes in the model, respectively.
