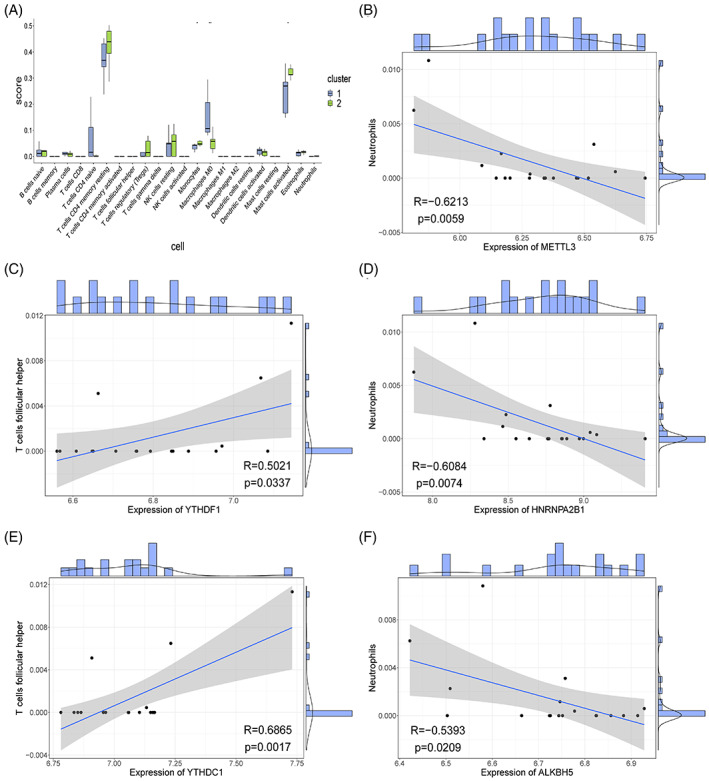
FIGURE 11.

Immune infiltration assessment using CIBERSORT. (A) Immune scoring box chart. X‐axis represents 22 kinds of immune cells, y‐axis represents the level of immune infiltration, and each colour represents sample grouping. Wilcoxon rank sum test was used for statistical analysis. The above symbol represents the significance level of difference, * represents P < .05, ** represents P < .01, *** represents P < .001, **** represents P < .0001, and ns represents not significant. (B‐F) Correlation scatter. Each point in the figure represents a sample, the straight line is the correlation fitting curve, the shaded part is the confidence interval, and the outside of the figure is the histogram and density curve.
