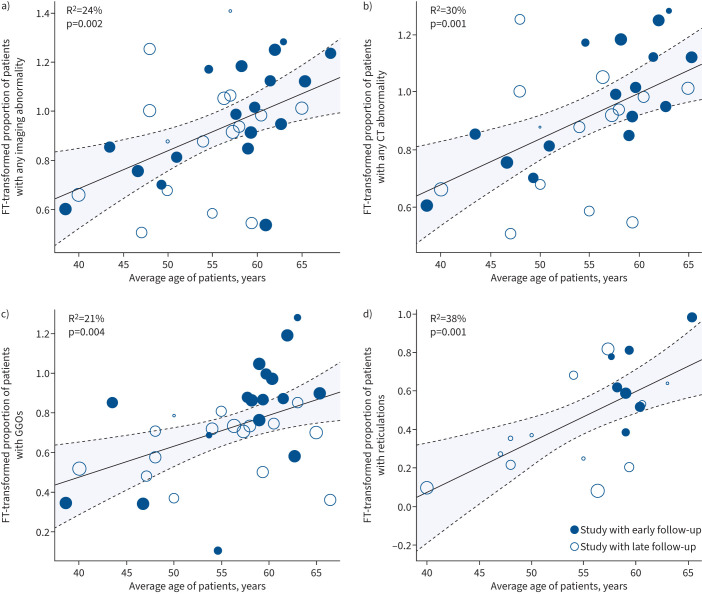
FIGURE 4.
Meta-regression between proportion of subjects with imaging abnormalities and mean age of cohort. Meta-regression analysis between mean age in cohort and proportion of patients with a) any abnormality, b) only computed tomography (CT) abnormalities, c) ground-glass opacities (GGOs), d) reticulations. FT: Freeman–Tukey. The size of the circle is proportional to the size of the patient cohort.

