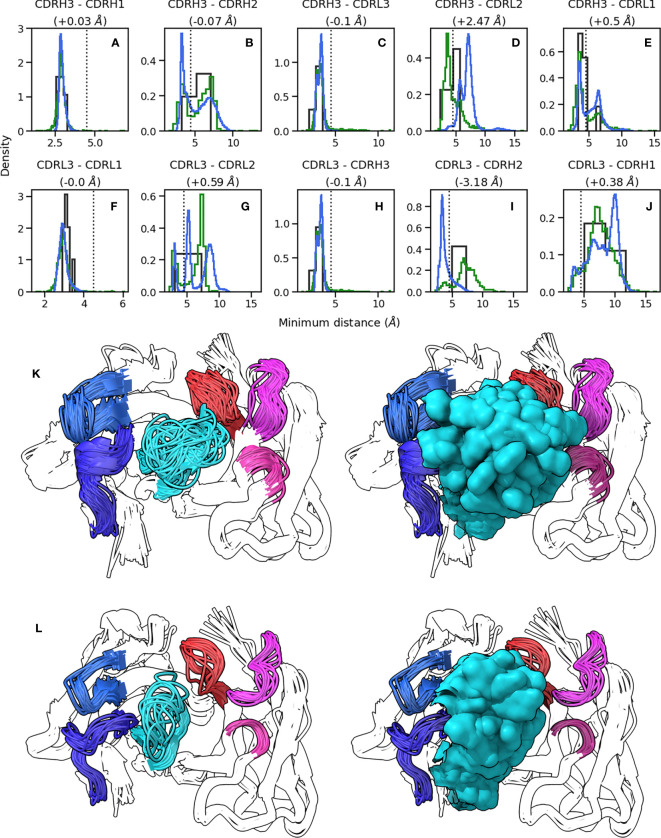
Figure 2.
Conformations explored by CDR-H3. (A-J) show minimum heavy atom distances between pairs of loops. Green histograms correspond the crystal structures, blue histograms refer to simulation data, and black histograms refer to crystal structures of systems used to perform simulations. (K, L) show the conformations of CDR-H3 loops in cluster representatives extracted from simulation data clustered on CDR RMSD after alignment on the framework regions. CDR-H3 and CDR-L3 are shown in cyan and red, respectively. CDR-H1 and CDR-H2 are shown in dark and light blue, respectively. CDR-L1 and CDR-L2 are shown in magenta and pink, respectively. (K) shows results for 1e6j, whereas (L) shows results for 3l5x.

