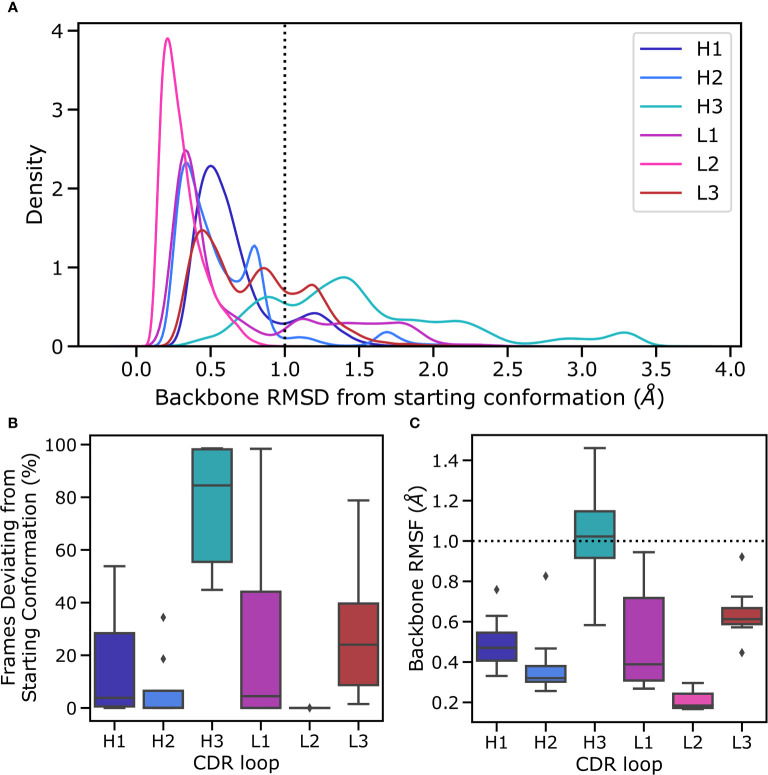
Figure 3.
Flexibility of CDR loops in the simulation data set. All loops were individually aligned on their anchor residues, defined as the three residues on either side of the loop. (A) pooled RMSD values for each loop relative to the crystal structure (the histograms were smoothened using a kernel density estimation), (B) the fraction frames where loops were found in their starting conformations for each antibody, defined as being within 1Å of the crystal conformation, and (C) the RMSF of loops for each structure, defined as the time average of the RMSD are reported.

