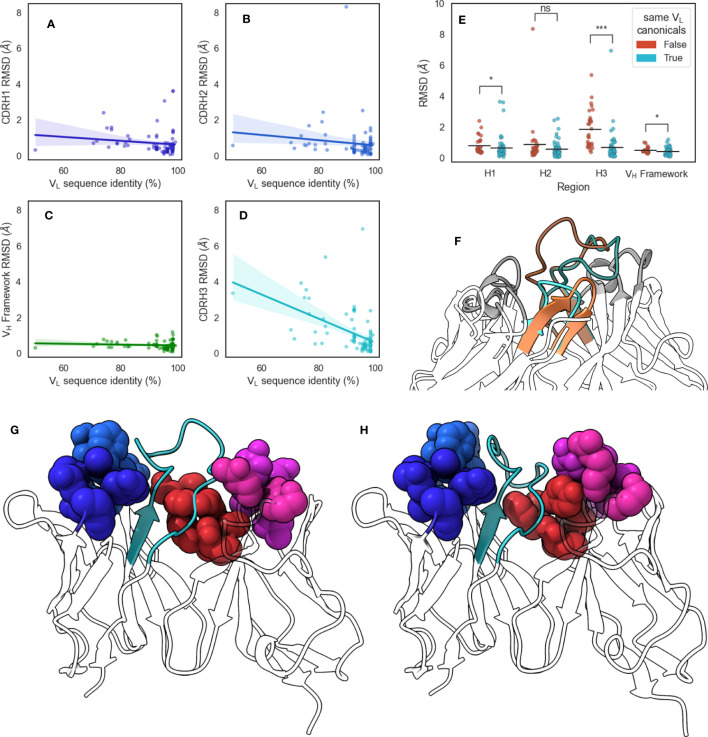
Figure 6.
Changes in CDR-H3 conformation upon changes in VL sequences. We extracted from SAbDab pairs of structures that have identical VH but different VL sequences and aligned structures on the VH framework regions before calculating RMSD values of (A) CDR-H1, (B) CDR-H2, (C) VH framework, and (D) CDR-H3 regions. Lines of best fit are reported with shaded areas corresponding to 95% confidence intervals. (E) shows the comparison of region RMSDs in the VH-identical pairs when all VL loops have the same canonical forms, or when at least one loop is has a different canonical form. Statistical significance was calculated using Mann-Whitney U tests (ns: not significant, *: 0.005< p< 0.05, ***: p< 5 × 10⁻⁷) (F) shows the change in CDR-H3 conformation for VH-identical pair 5y2k (orange) and 5y2l (cyan). CDR-H3 loops are shaded using darker colors, and CDR-L3 loops are shown in lighter shades. (G) shows 5y2k with a shallower groove occupied by CDR-H3 due to the longer CDR-L3 and shorter CDR-L1 loop, whereas (H) shows 5y2l with a deeper groove occupied by CDR-H3 due to the shorter CDR-L3 and longer CDR-L1 loop. Minor loops are shown using spheres, with CDR-H3 shown in cyan.

