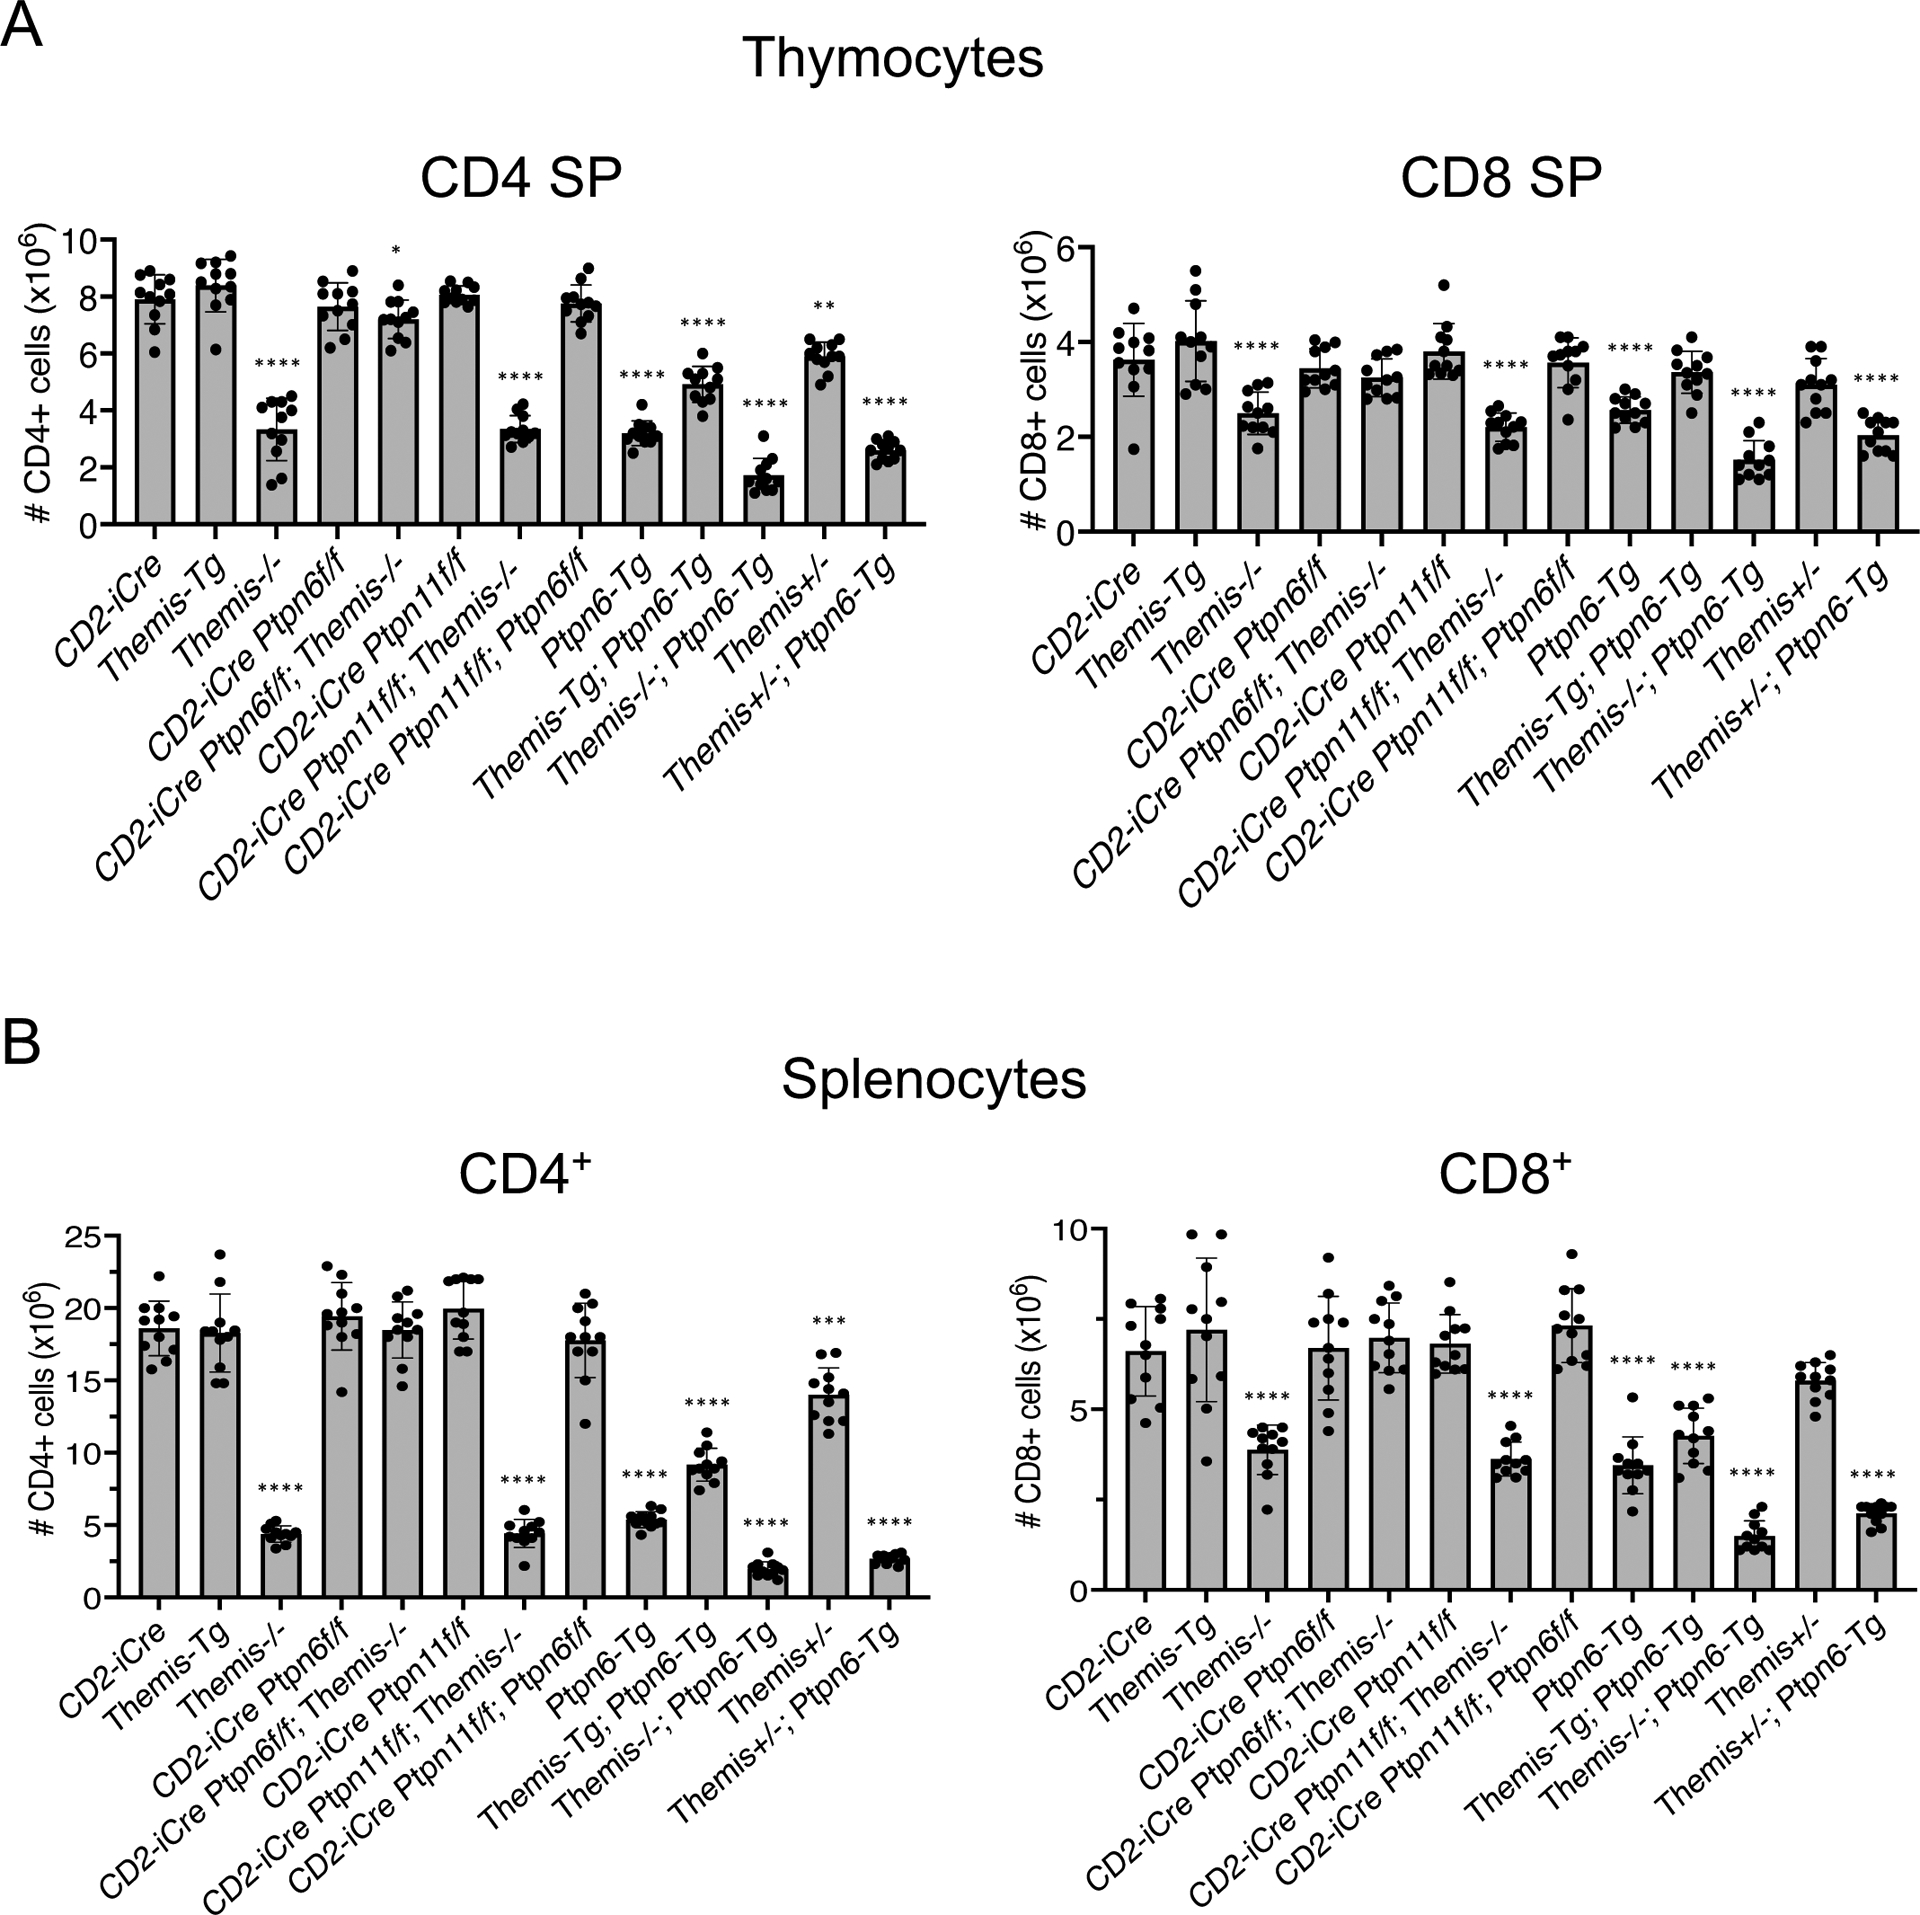
Fig. 2. Evaluation of thymocyte and T cell subset numbers in mice.

(A and B) Numbers of CD4 SP (left) or CD8 SP (right) thymocytes (A) and CD4+ (left) or CD8+ (right) splenocytes (B) from mice of the indicated genotype. Data are means ± SD of thymocyte or T cell subset numbers and were analyzed by two-tailed, type 2, t test. *P < 0.05, **P < 0.01, ***P < 0.005, ****P < 0.001. All comparisons are to CD2-iCre controls.
