
Fig. 2.
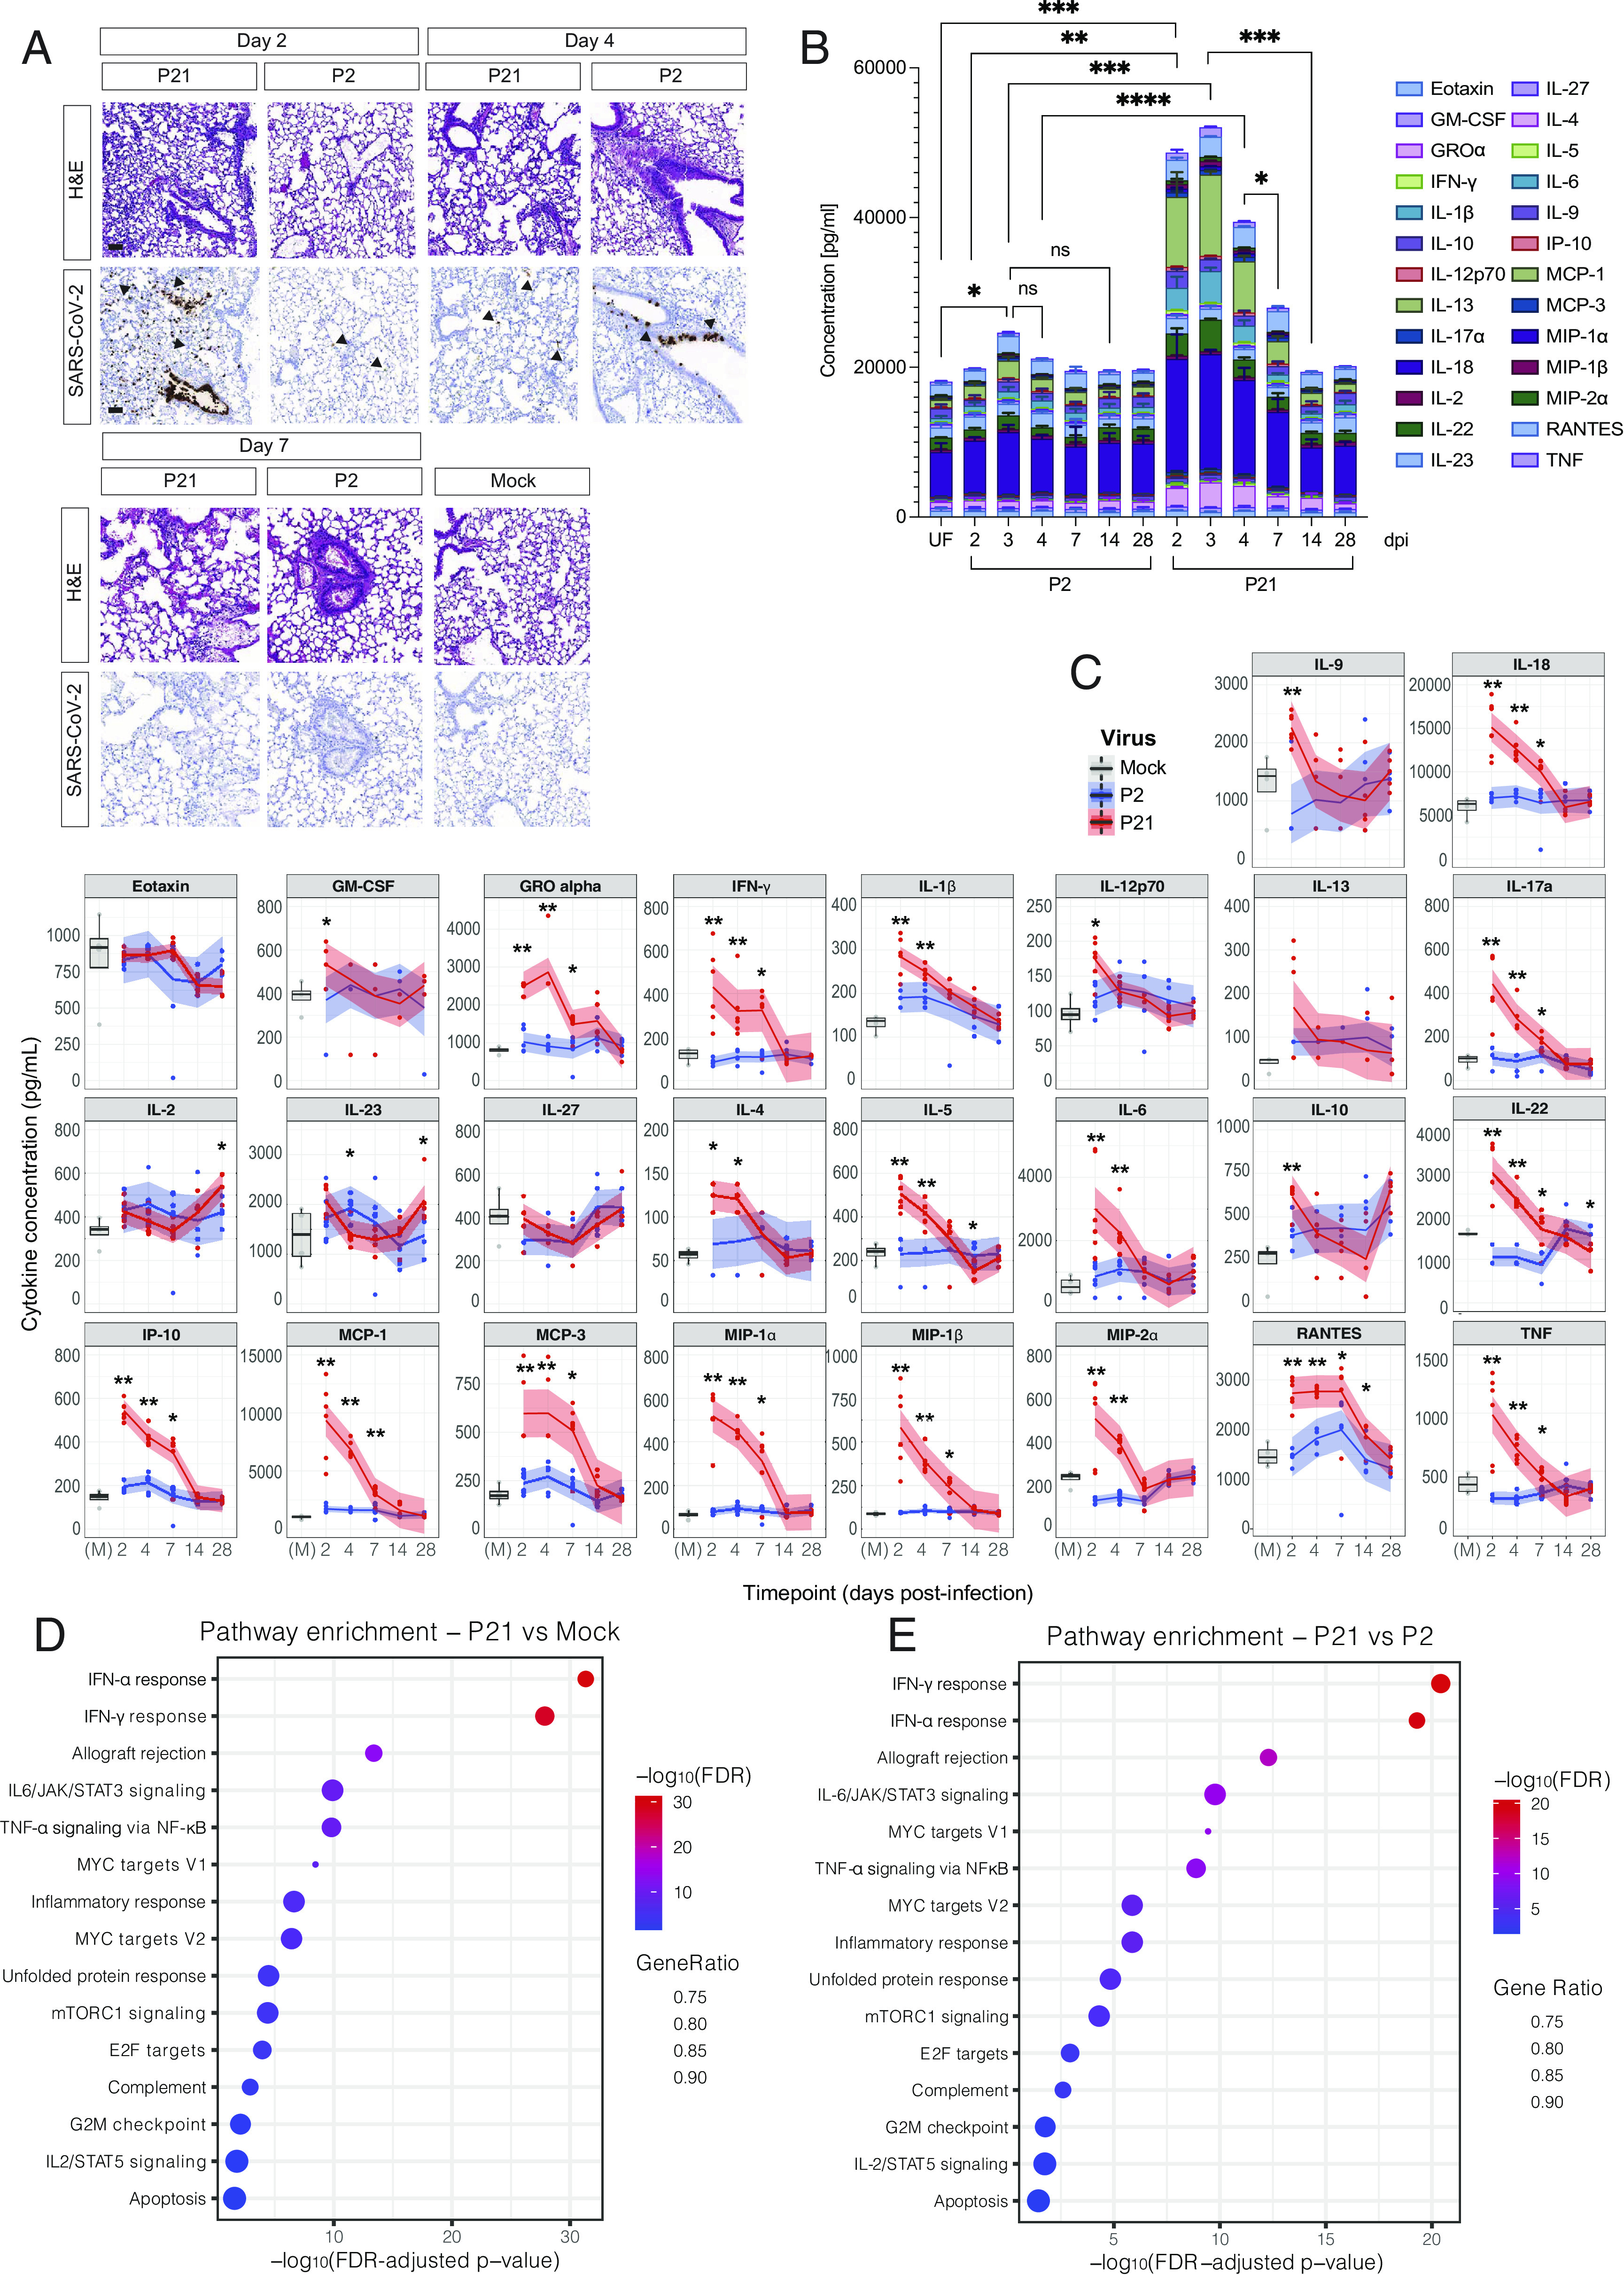
P21 infection induces severe lung disease, cytokine storm, and changes in the host transcriptome. (A) Representative images of hematoxylin and eosin (H&E) and SARS-CoV-2 nucleocapsid stained lungs. Mice were infected intranasally with 104 TCID50 of P2, P21, or mock (media only), and lungs were collected and fixed for histological analysis at days 2, 4, and 7 postinfection. Histological images are representative of at least 3 animals. Black arrows point to exemplary SARS-CoV-2-positive cells. (Scale bars, 50 µm.) (B) Mice were infected intranasally with 104 TCID50 of either P2, P21, or inoculated with vehicle control (M = mock infection). Supernatants of lung homogenates were taken at days 2, 3, 4, 7, 14, and 28 postinfection for analysis of 26 cytokines/chemokines. The concentration of all measured cytokines/chemokines for each animal were summed, and mean ± SD of each cytokine is shown. Colours represent different analytes (n = 4 to 5, 6 to 8-wk old mice per group). (C) Cytokine analysis of infected mice over time. Lungs of animals infected with 104 TCID50 of P2 or P21 were collected at days 2, 4, 7, 14, and 28 postinfection and utilized for ELISA of 26 different cytokines and chemokines. Each panel displays mock- (gray), P2- (blue), and P21- (red) infected animals. Boxplots of mock-infected samples depict the median and interquartile ranges. Loess smoothing was applied to the P2 and P21 infection time course, with the shaded area indicating 95% CIs. (D and E) Pathway enrichment analyses of significantly differentially expressed genes identified from P21- vs. mock-infected mice and P21- vs. P2-infected mice comparisons using Hallmark gene sets. Negative log10 FDR-adjusted P values associated with each pathway are plotted; dot sizes correspond to the proportion of all genes from that pathway that were found to be significantly differentially expressed in a given comparison (Gene Ratio). Two-way ANOVA with multiple comparisons (B) and Wilcoxon rank-sum (C) statistical tests were performed; *P < 0.05, **P < 0.01, and ***P < 0.001.