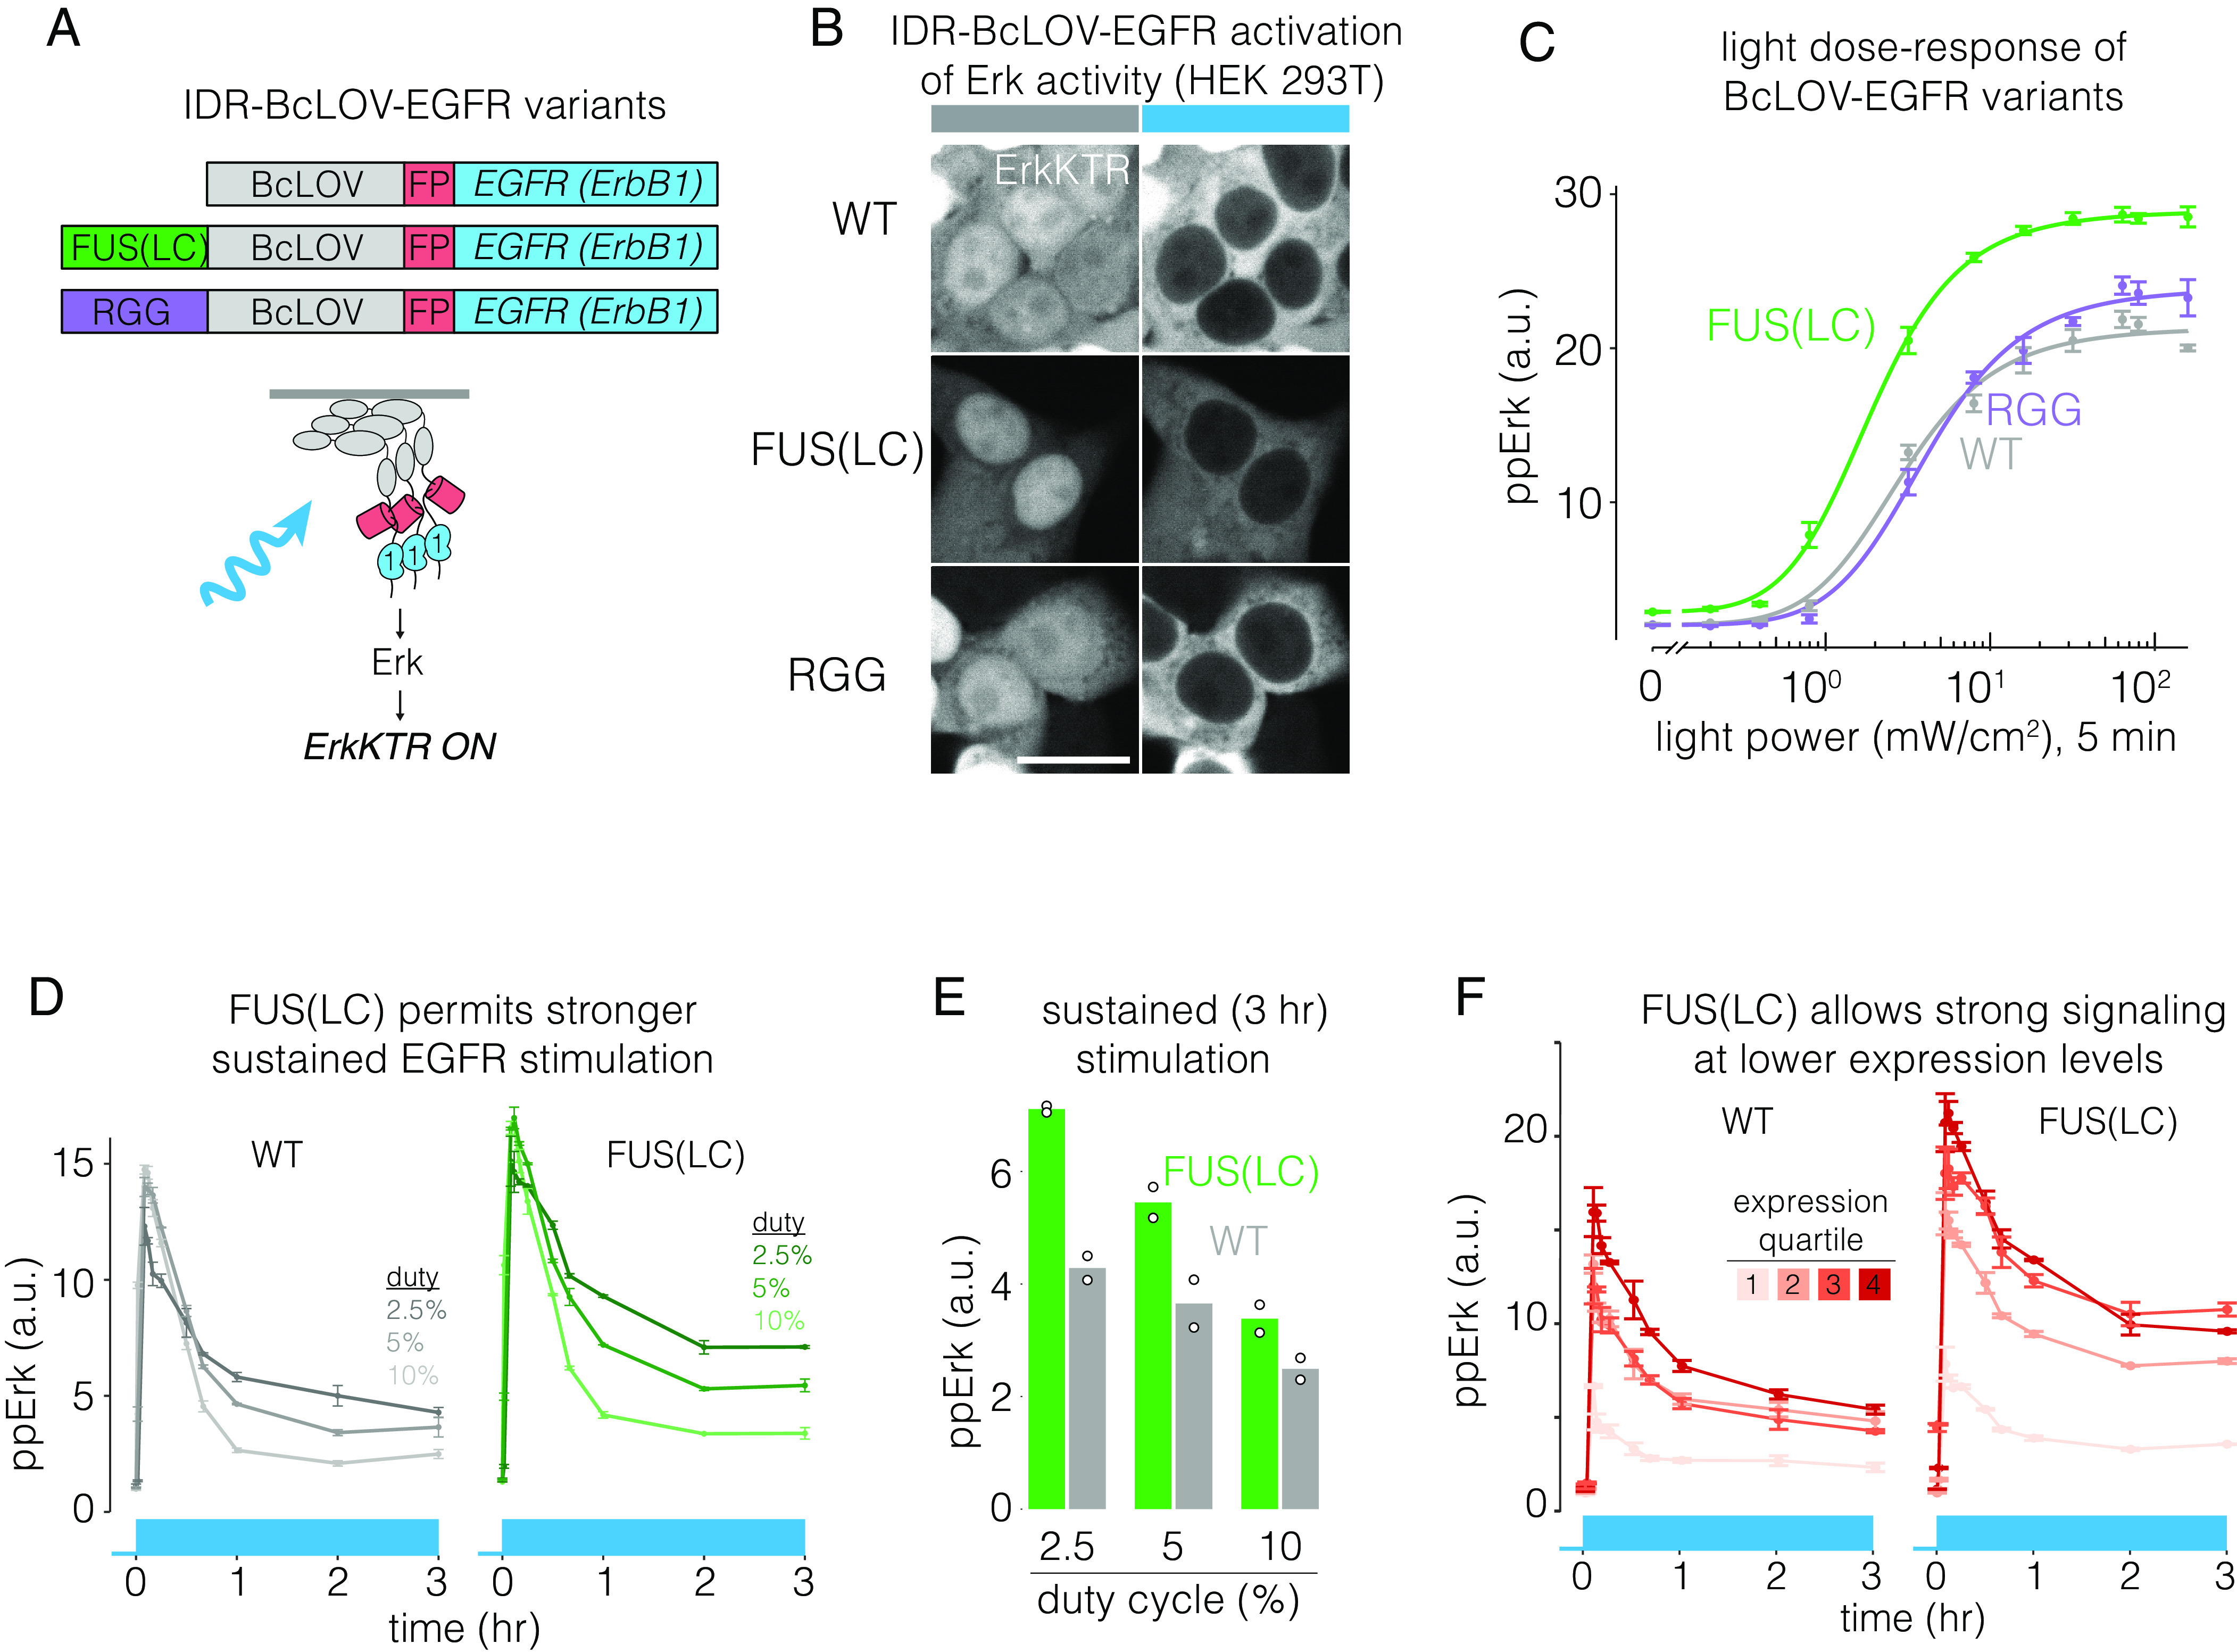
Fig. 5.

IDRs enhance sensitivity and strength of BcLOV-EGFR. (A) IDR-fused variants of BcLOV-EGFR. (B) IDR-BcLOV-EGFR variants stimulated ErkKTR-miRFP under blue light in HEK 293T cells. (Scale bar, 20 μm.) (C) Dose-response of light intensity on ppErk after 5 min of constant illumination at the indicated light dosages. Data represent the mean ± SEM of four replicates, each representing the mean from ~2,000 to 4,000 cells. (D) Comparison of sustained stimulation of wt or FUS-fused BcLOV-EGFR at variable duty cycles of stimulation. See SI Appendix, Table S1 for details of optogenetic stimulation parameters. (E) Steady-state levels of ppErk after 3 h of stimulation. FUS-BcLOV-mCh allowed stronger steady state levels of ppErk at all duty cycles tested. For (D), data represent mean ± SEM of two replicates, each representing the mean of ~2,000 to 5,000 cells. Datapoints in (E) are the mean steady-state ppErk levels at 3 h shown in (E). (F) FUS(LC) decreases the concentration of the BcLOV probe required to achieve a given signaling level. Data points represent mean ± SEM of two replicates, with each replicate representing the mean of 400 to 1,500 cells per expression quartile.
