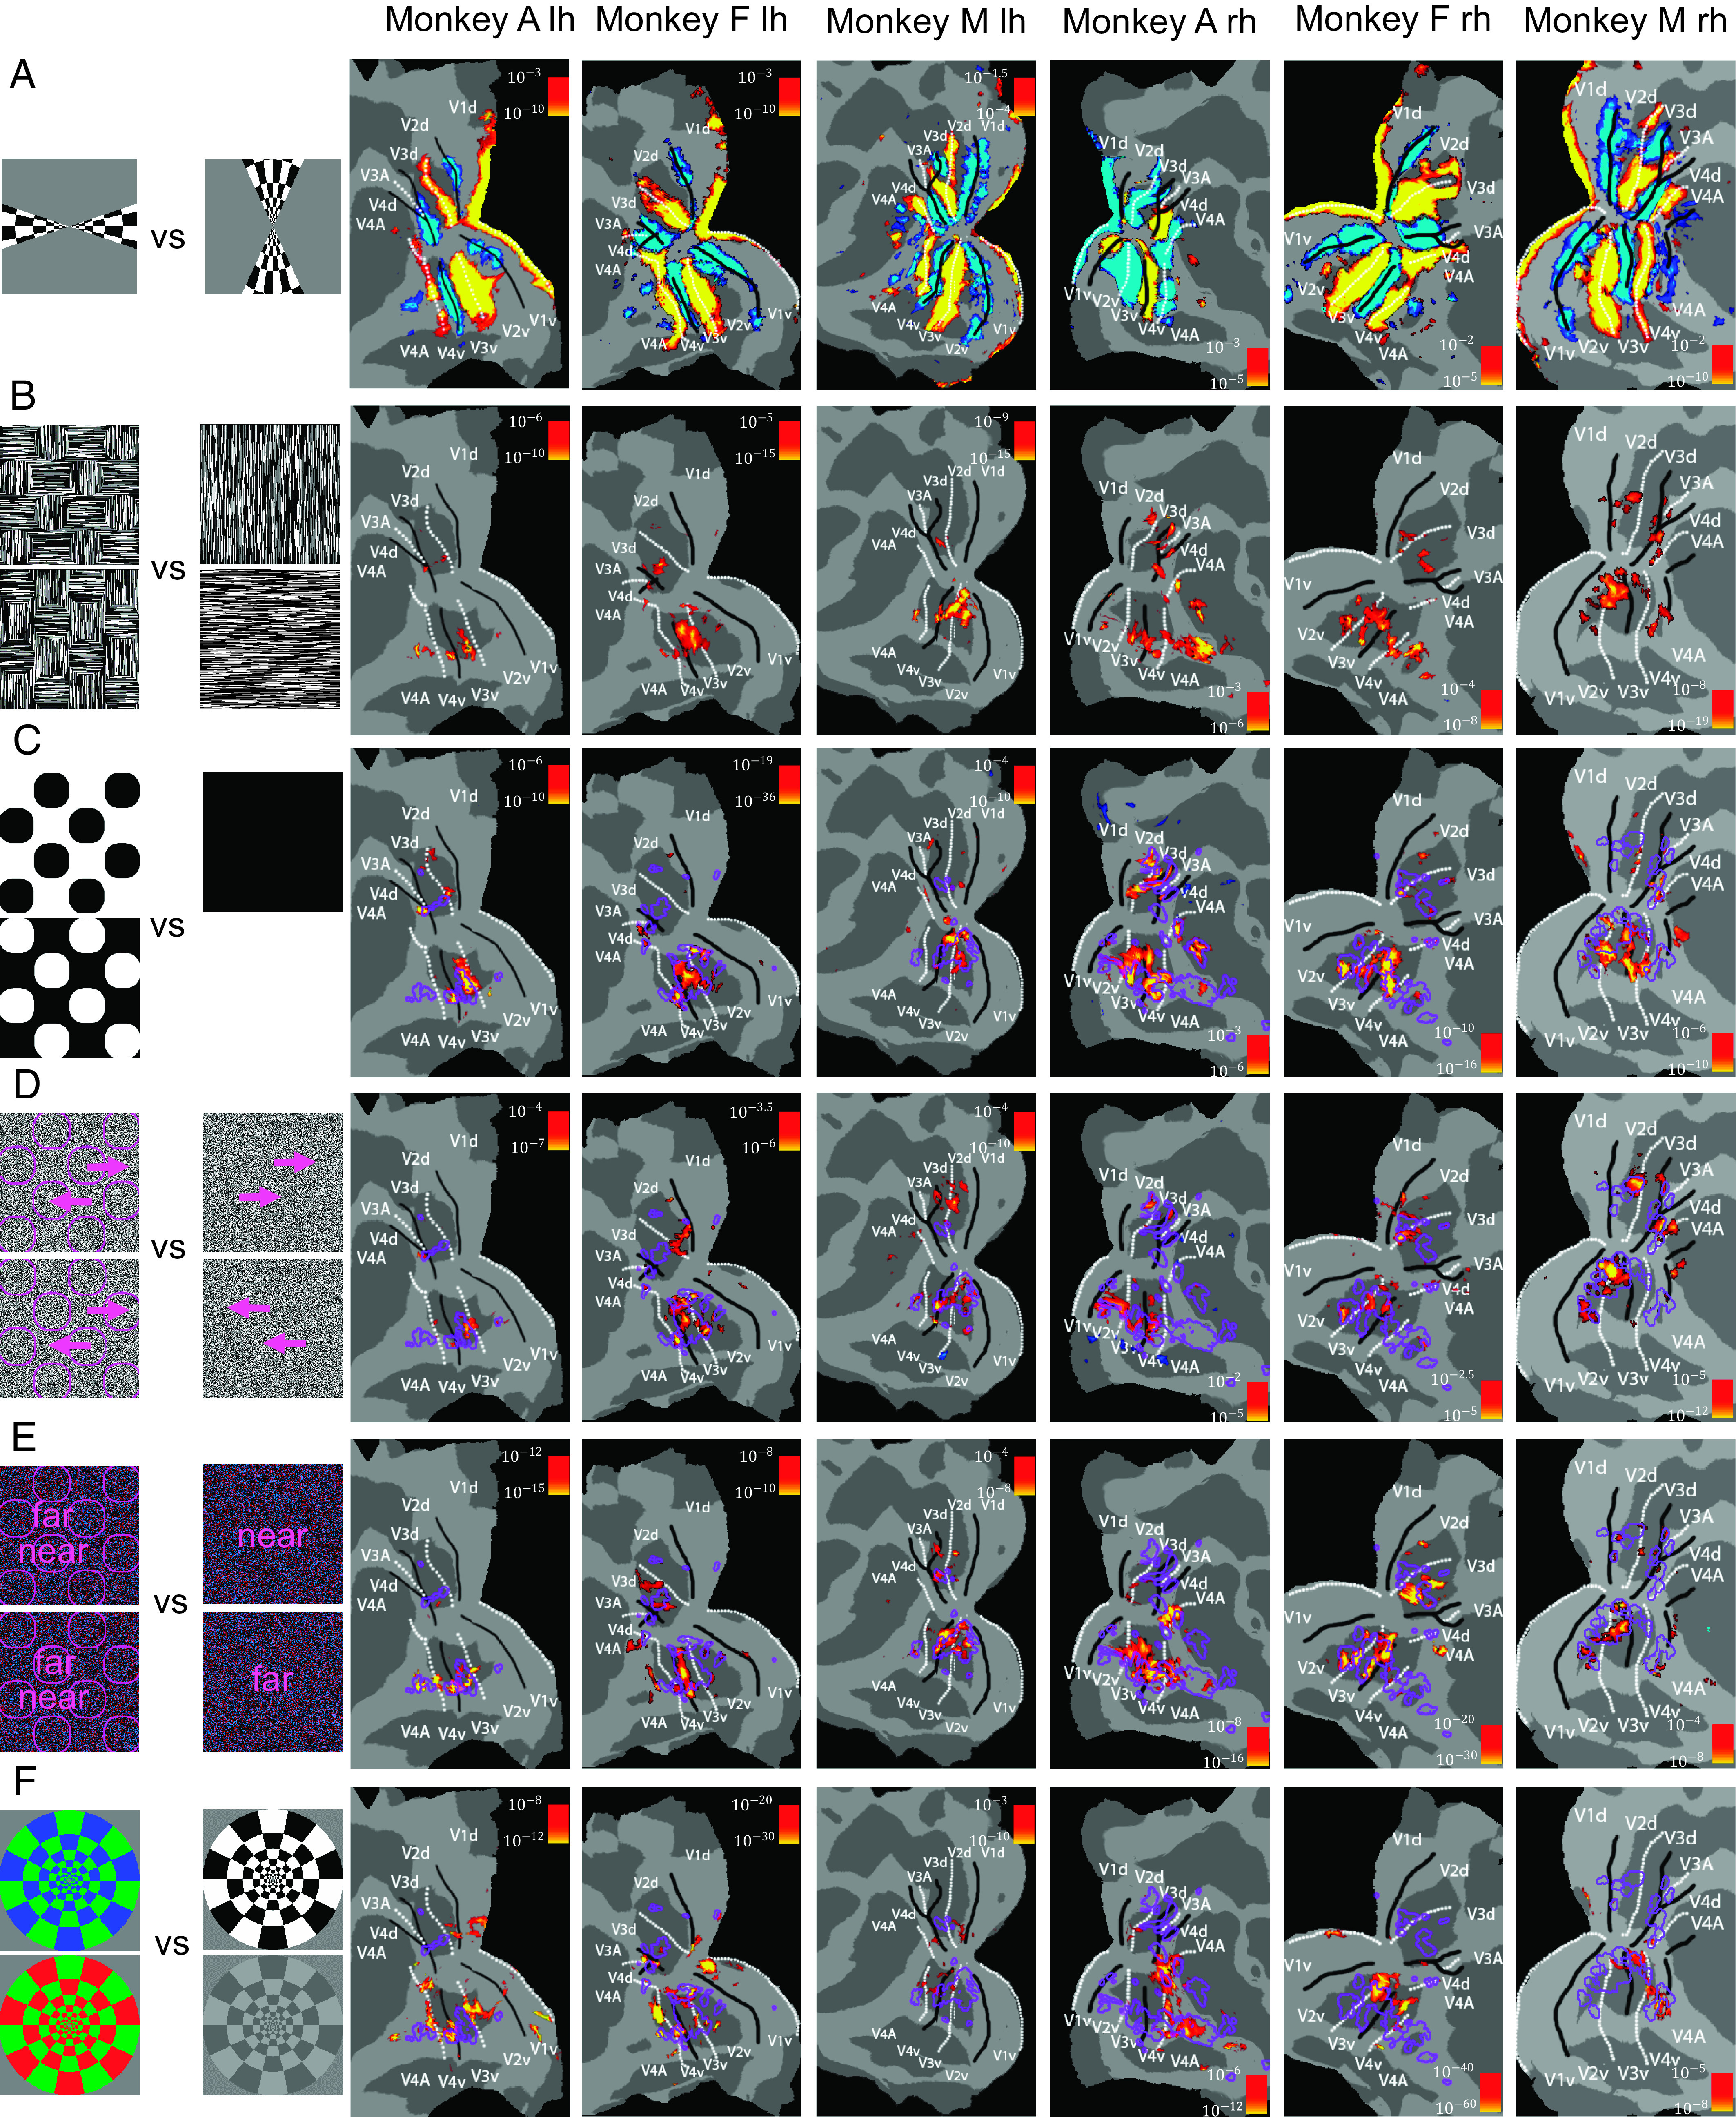
Fig. 1.

Patches of segmentation-related signals in visual cortex. A series of fMRI experiments were performed in three monkeys and activations were overlaid on patches of the left and right hemispheres of flattened brain surfaces. Rows correspond, from top to bottom, to (A) retinotopy, (B) texture figures versus background, (C) luminance figures versus background, (D) motion figures versus background, (E) disparity figures versus background, (F) color versus black and white. Color bars indicate P values of contrasts; lh: left hemisphere, rh: right hemisphere.
