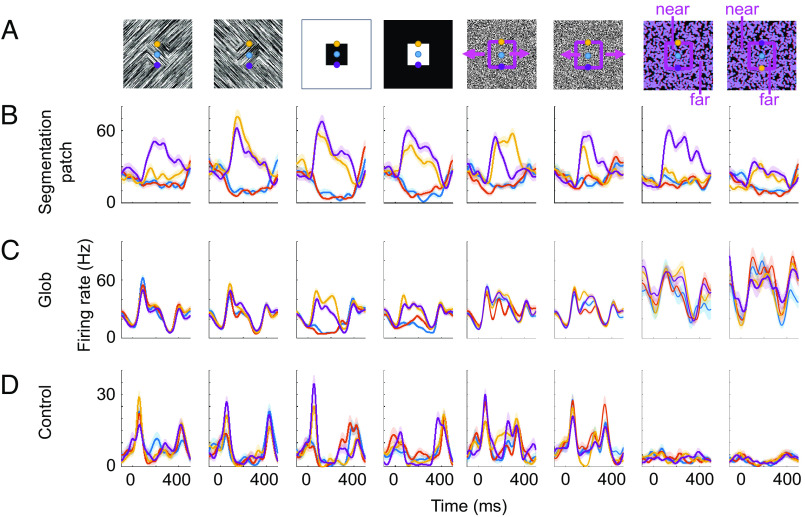
Fig. 3.
Example cells from segmentation patches, globs, and control regions. (A) Stimuli consisted of the center (blue), top edge (yellow), or bottom edge (purple) of a single square presented on the receptive field or just background without a square (red, stimuli not shown). Columns correspond to different modalities (texture, luminance, motion, and disparity) and contrast polarities where the quality of figure and background were swapped. (B) Trial-averaged responses from an example segmentation patch cell. X axis and Y axis correspond to time aligned to stimulus onset (t=0) and firing rate, respectively. Different colored lines correspond to response time courses when the receptive field was on the square center (blue), top edge (yellow), bottom edge (purple), or background (red). Shaded areas indicate SEM across trials. (C) Same as (B) for an example glob cell. (D) Same as (B) for an example control cell.

