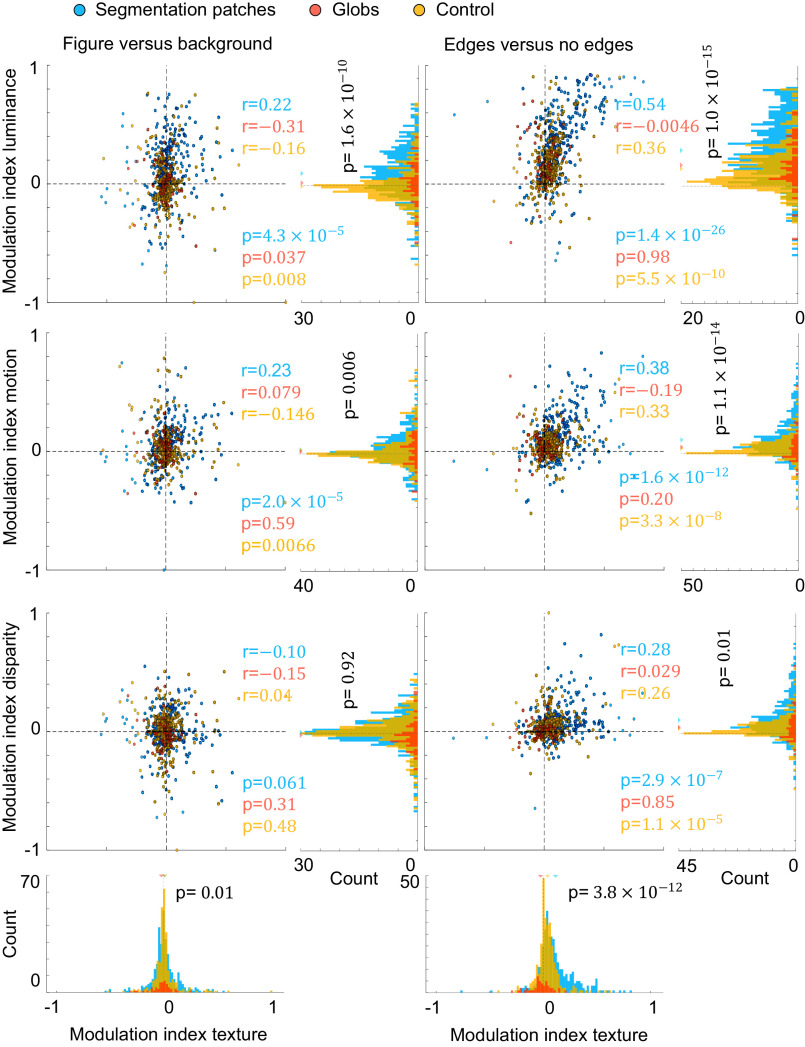
Fig. 4.
Single cells in segmentation patches have consistent segmentation signals. For the left panel, we computed the modulation indices for stimuli where a figure was centered on the receptive field versus background stimuli. For the right panel, we computed the preference for stimuli where a border was centered on the receptive field versus stimuli where no border was in the receptive field. We computed these modulation indices based on average responses for a given modality, namely, texture on the x-axes, and luminance, motion, or disparity on the y-axes. For scatter plots, each circle represents one cell from segmentation patches (blue), globs (red), or control regions (yellow), and its position represents the modulation indices for a pair of modalities of that cell. Correlation coefficients r and corresponding P values are provided in blue, red, and yellow, for segmentation patches, globs, and control region, respectively. Histograms represent marginal distributions of modulation indices for a single modality, using cells from segmentation patches (blue bars), globs (red bars), or control regions (yellow bars). For each histogram, P values for unpaired t tests comparing absolute values of modulation indices for cells from segmentation patches and cells from globs/control regions are shown in black.

