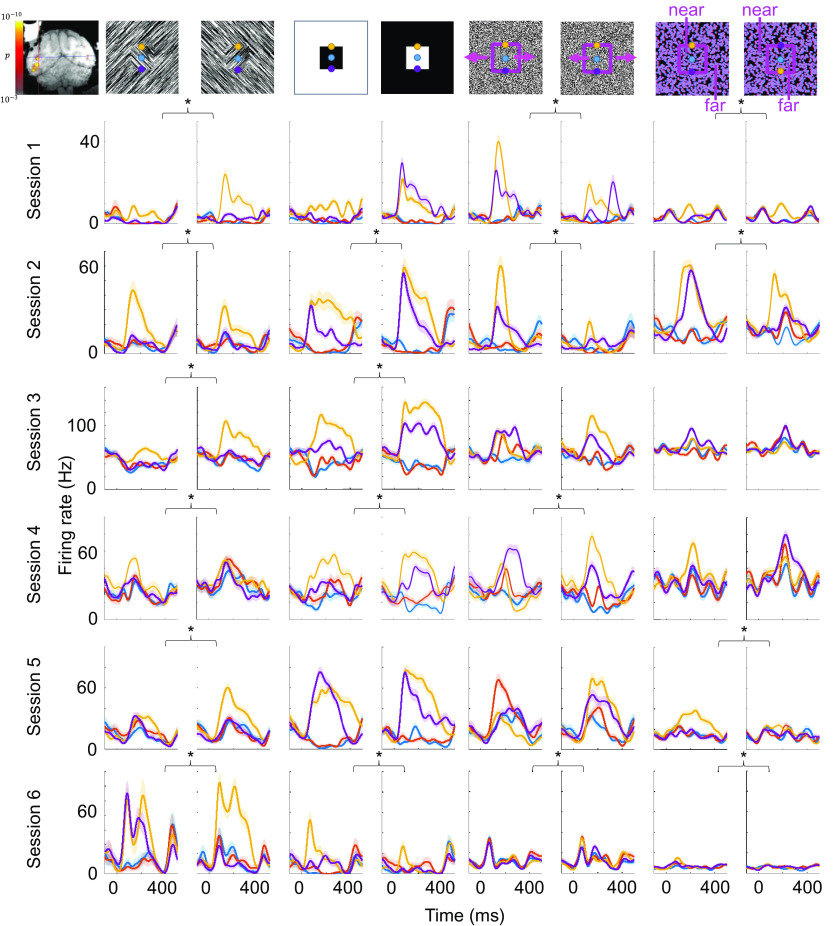
Fig. 5.
Cluster of consistent border-ownership cells across days. Same conventions as in Fig. 3 but every row corresponds to a cell recorded from the same site in different sessions in monkey F. Inset on the top left shows electrode targeting the patch with fMRI contrast overlaid. Asterisks indicate which of the four modalities showed a significant and consistent border-ownership preference for each cell.

