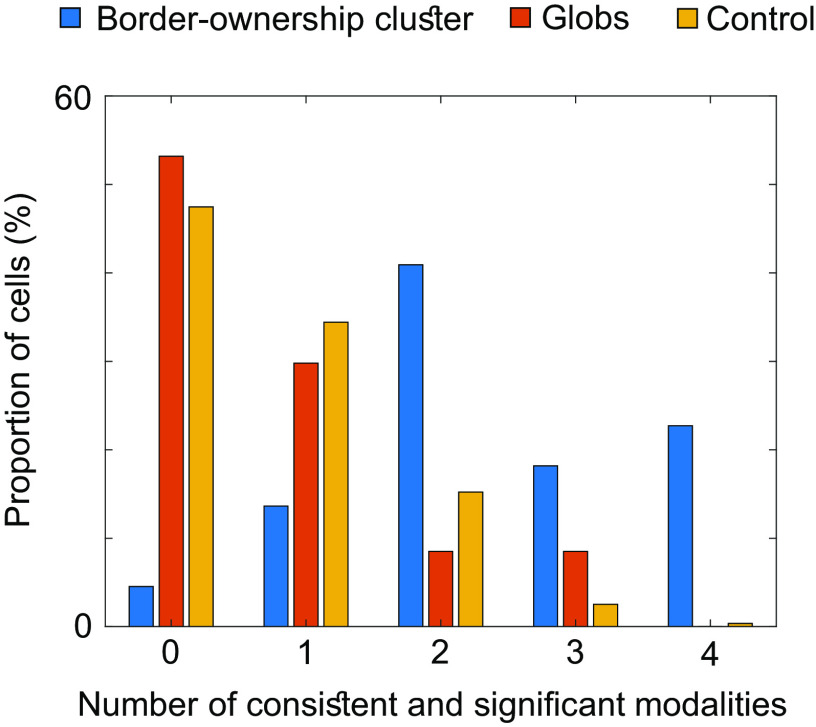
Fig. 6.
Much higher proportions inside the border-ownership cluster of monkey F (cf. Fig. 5) show consistent coding of border ownership. Bars indicate proportions of cells within the border-ownership cluster (blue), globs (red), and control regions (yellow), respectively, that were significantly and consistently tuned to border-ownership across a given number of modalities (shown on the X axis). For a given modality, responses across all trials of top edge and bottom edge, respectively, were averaged to determine if the cell preferred top edge or bottom edge for that modality. To determine if this preference was significant, two-sample t tests across trials were performed (threshold P<0.05). For each cell the number of modalities where the cell was significantly tuned to side-of-figure and where the cell preferred the same side-of-figure as for texture, was computed, to produce the histogram. For texture, only significance was required to reach the significant and consistent criterion.

