Fig. 1.

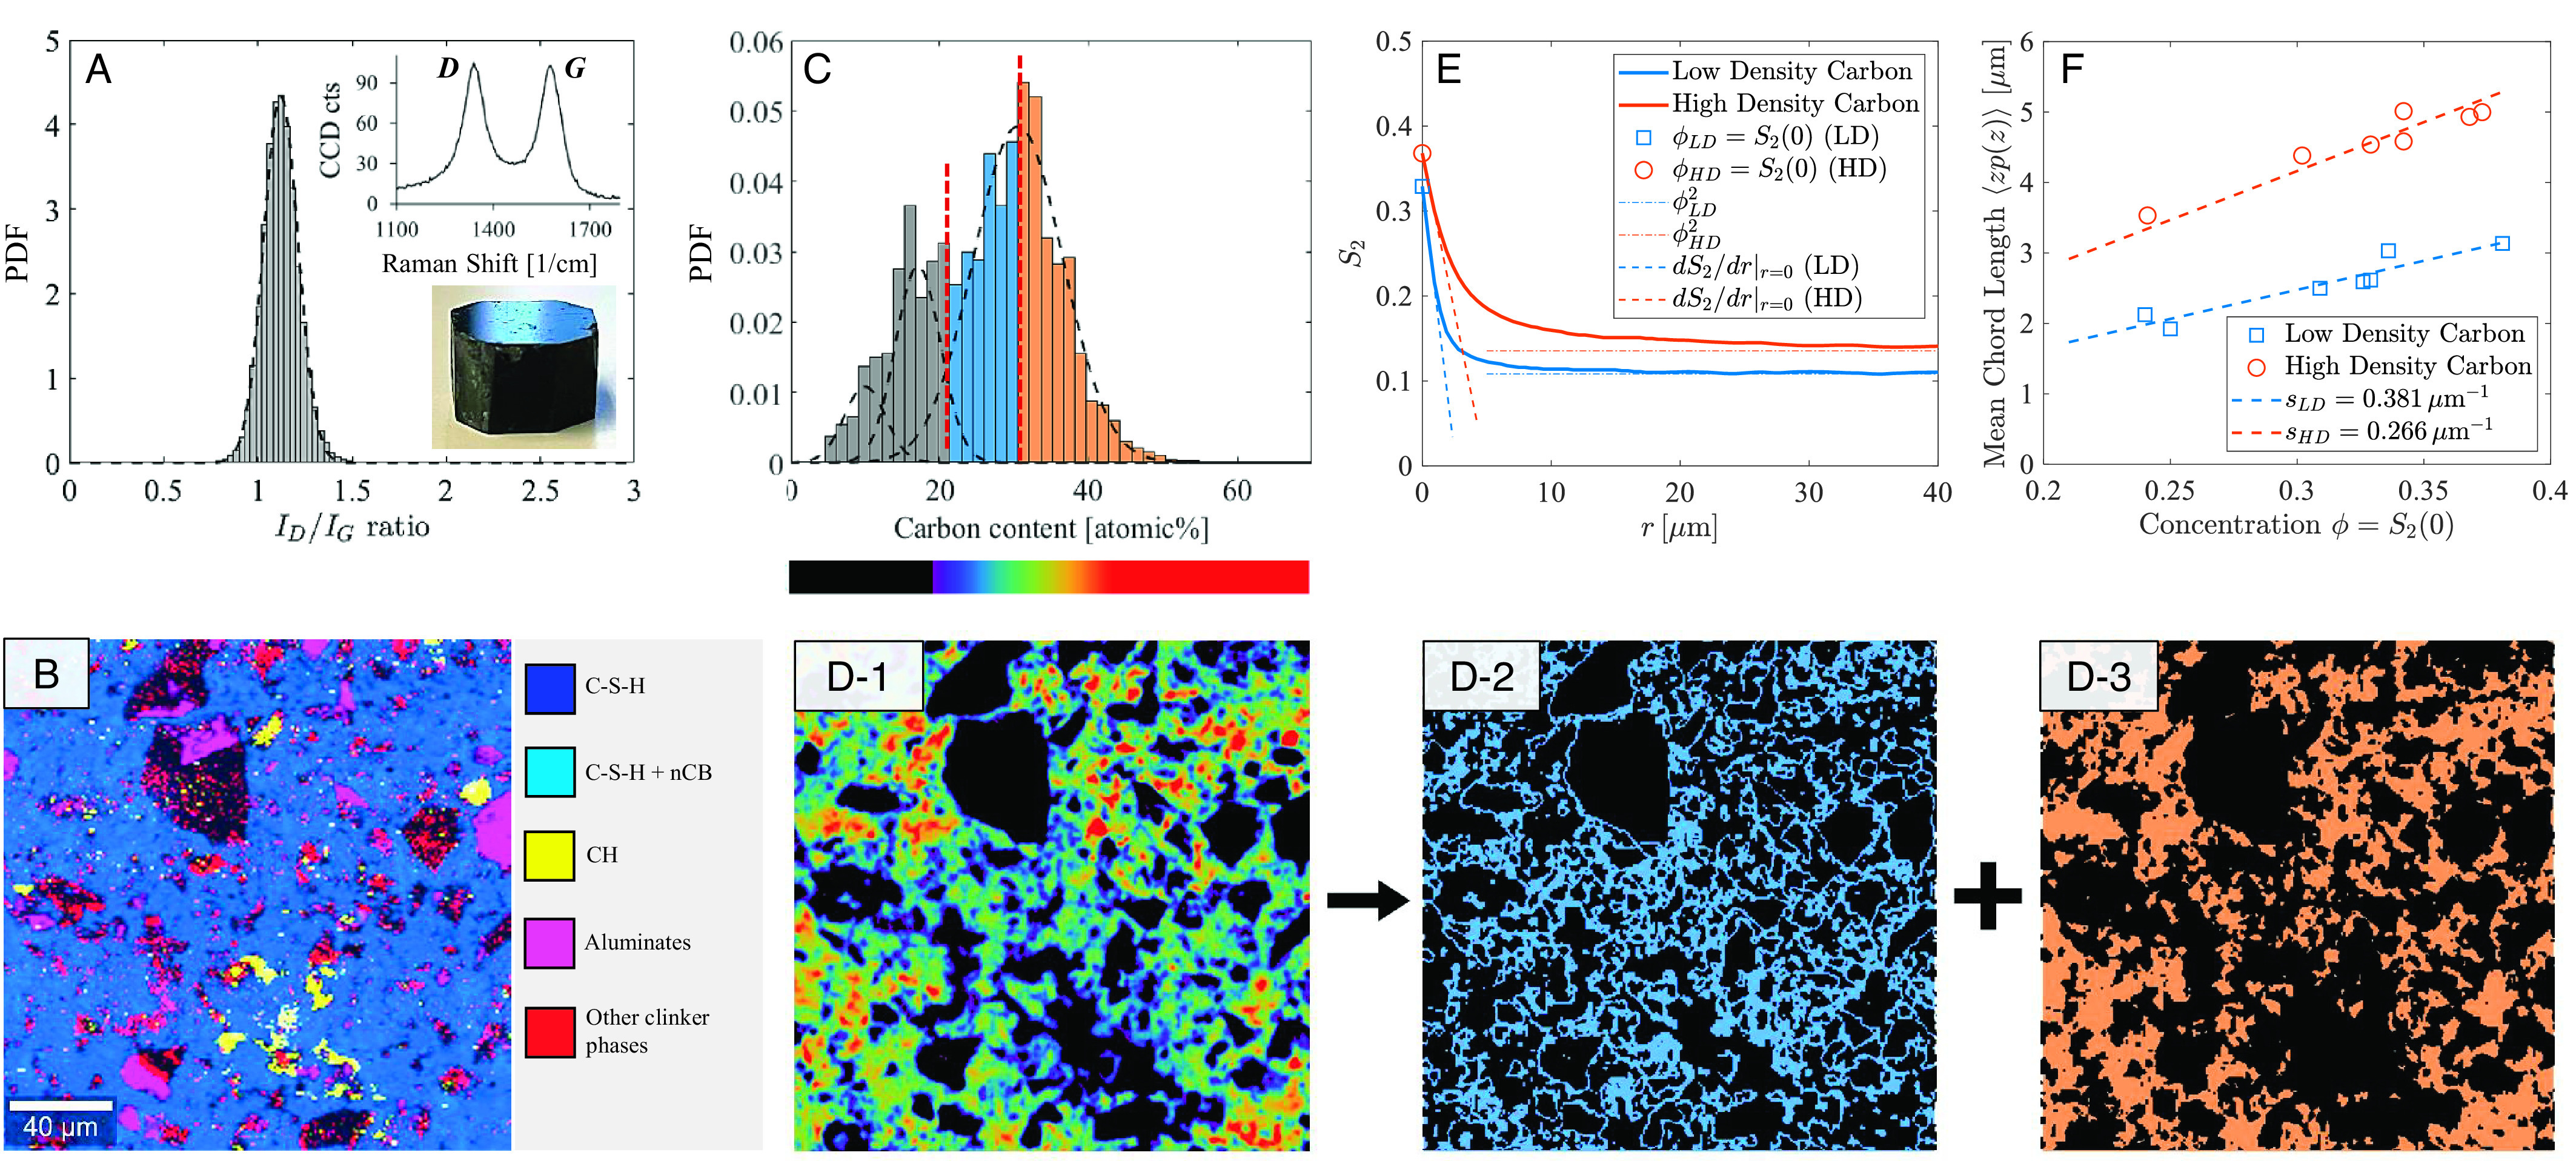
Correlative EDS–Raman Spectroscopy analysis: (A) Raman carbon intensity ratios ID/IG obtained from a 200 × 200 μm region of a carbon-cement sample [PBX55 (12), W/C=0.42, nCB/C=0.101; SI Appendix]. The inset displays the D and G bands of the carbon black (PBX55) powder associated, respectively, with defects in the C–C lattice structure, and the graphitized carbon structure, which allows us to distinguish carbon black particles from background carbon products resulting from cement carbonation. (B) Raman map from a polished section with their constituent major phases indicated. (C) Deconvolution of carbon content (in atomic %) from EDS mapping data identifies three distinct phases: the low carbon content phase (in gray) is background carbon which is also found in the control cement samples, whereas the dominating phase (in blue and orange) is correlated to the ID/IG ratio (shown in A). (D-1) By deconstructing our EDS data, we can subsequently map the distributions of (D-2) A low-density carbon phase (below mean value in C, blue bars), and (D-3) A high-density carbon phase (above mean value in C, orange bars). (E) The two-point correlation function, S2(r = |ri − rj|) = ⟨I(ri)I(rj)⟩ (with I(rj) the indicator function, I(rj)=1 if rj ∈ Vk, k = LD, HD, else I(rj)=0), of the two phases permits determination of phase concentration, ϕ = S2(0), mean chord length, ℓ = ⟨zp(z)⟩ = −S2(0)/S2′(0) (with p(z) the chord length probability distribution, and S2′(0)=dS2/dr|r = 0 the slope of S2(r) at r = 0 shown in the figure), and specific surface area, s = −πS2′(0) of low- and high-density carbon phase. (F) Applied to seven samples of different mix design and carbon black constituents (12–14), a linear scaling of mean chord length with phase concentration is indicative of a unique specific (texture) surface of low- and high- density carbon phase, si = πϕi/ℓi, for i = LD, HD.
