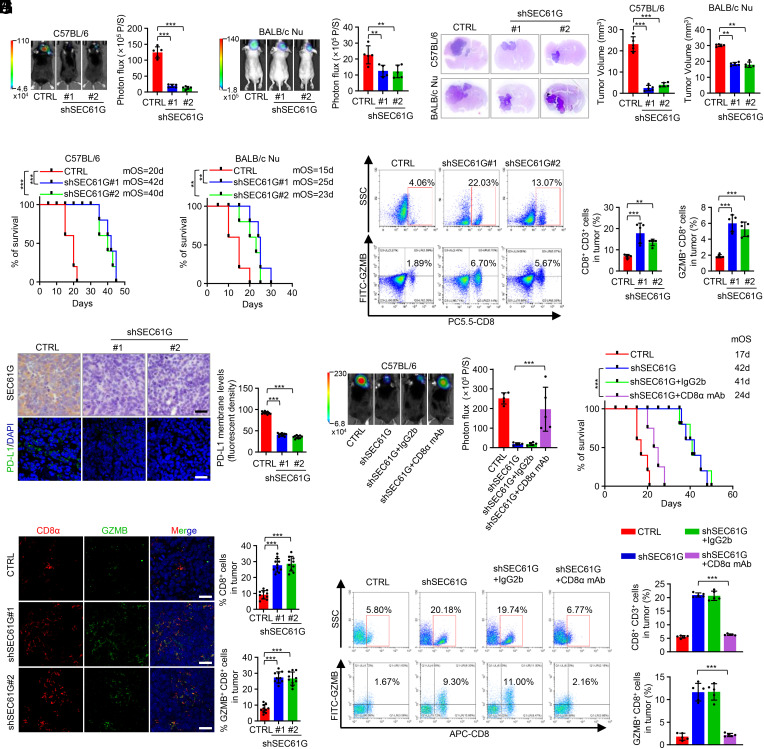
Fig. 3.
Depletion of SEC61G inhibits GBM tumorigenesis by enhancing antitumor T cell immunity. (A and B) GL-26 cells (5 × 10⁵ cells/mouse) stably expressing control shRNA or SEC61G shRNAs were injected intracranially into C57BL/6 mice (A) or BALB/c nude mice (B). Tumor growth was monitored by bioluminescence imaging. Representative images are shown, and tumor bioluminescence was quantified (mean ± SD. n = 5 mice for each group, one-way ANOVA test). **P < 0.01, ***P < 0.001. (C) Three weeks after injection, the mice were humanely killed, and tumor growth was assessed. The hematoxylin and eosin (H&E)-stained sections show representative tumors. Tumor volumes were calculated (mean ± SD, n = 5 mice for each group, One-way ANOVA test). ***P < 0.001. (D) The survival of mice was evaluated (n = 5 mice for each group, Kaplan–Meier model with a two-sided log-rank test). **P < 0.01, ***P < 0.001. (E) Flow cytometry analysis demonstrated the population of CD8+ and GZMB+ CD8+ cells in CD3+ TILs of mouse GBM tissues. Representative plots and quantification of flow cytometry are shown (mean ± SEM, n = 5 independent experiments), **P < 0.01, ***P < 0.001. (F) Immunostaining of SEC61G and PD-L1 in mouse GBM tissues. Representative images are shown. (Scale bar, 100 µm.) The intensity of PD-L1 staining was quantified (mean ± SEM, n = 10 randomly selected microscope fields, Student’s t test). ***P < 0.001. (G) Mouse brain tissues were double stained with CD8α and GZMB. Representative images are shown. (Scale bar, 100 µm.) CD8 and GZMB levels were quantified by ImageJ (mean ± SEM, n = 10 randomly selected fields, Student’s t test). ***P < 0.001. (H) GL-26 cells (5 × 10⁵ cells/mouse) stably expressing control shRNA or SEC61G shRNAs were injected intracranially into C57BL/6 mice. Mice were then injected intraperitoneally with CD8α mAb (100 µg/mouse/d) or IgG2b (100 µg/mouse/d). Tumor growth was monitored by bioluminescence imaging. Representative images are shown, and tumor bioluminescence was quantified (mean ± SD. n = 5 mice for each group, one-way ANOVA test). ***P < 0.001. (I) The survival of mice was evaluated (n = 5 mice for each group, Kaplan–Meier model with a two-sided log-rank test). ***P < 0.001. (J) Flow cytometry analysis demonstrated the population of CD8+ and GZMB+ CD8+ cells in CD3+ TILs of mouse GBM tissues. Representative plots and quantification of flow cytometry are shown (mean ± SEM, n = 5 independent assays), ***P < 0.001.

