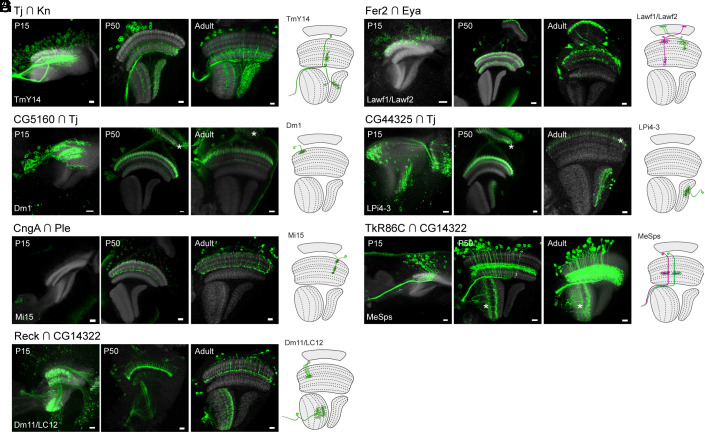
Fig. 4.
(A-F) Developmental characterization of selected gene-specific split-GAL4 lines targeting different cell types/clusters. Targeted cell types predicted by scRNAseq expression are shown in the lower left corner for each split-GAL4 line. The full expression pattern of each split-GAL4 line is shown with UAS-myr-GFP reporter at P15, P50, and adult stages. A schematic diagram of targeted cell types in adults is shown on the right in each panel. Asterisks indicate expression in the cell types not predicted by mixture modeling. Although other cell types are observed, the targeted cell types are always observed at multiple developmental stages. Anti-NCad staining (gray) is used for visualizing neuropils. Images are substack projections of full expression labeling to show distinct morphological features of distinct cell types. (Scale bar: 10 μm.)

