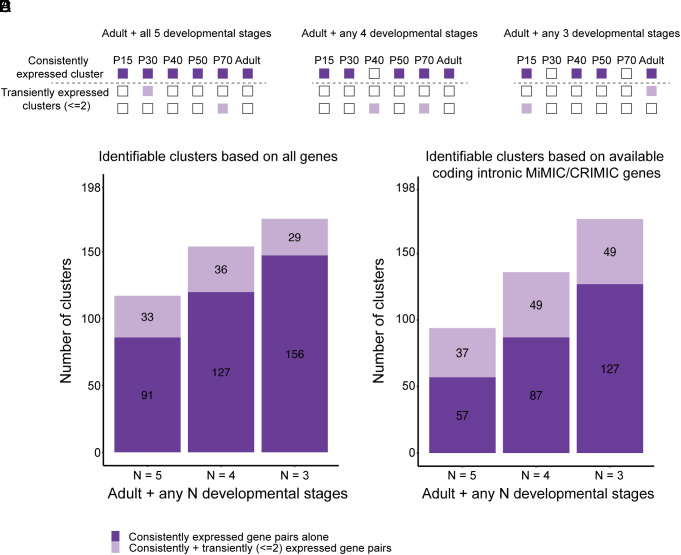
Fig. 5.
(A–C) Illustration of strategies to identify gene pairs that mark a cluster of interest throughout development with different stringency. Dark violet boxes indicate the stages when a gene pair is predicted to be on in the cluster of interest while light violet boxes indicate when the gene pair is predicted to be transiently active in other clusters. (D) Number of clusters that are predicted to be identified with gene pairs suggested by each strategy when all genes detected in the atlas are considered. (E) Number of clusters that are predicted to be identified with gene pairs suggested by each strategy when only considering genes with coding intronic MiMIC or CRIMIC lines available for RMCE (3,637 genes).

