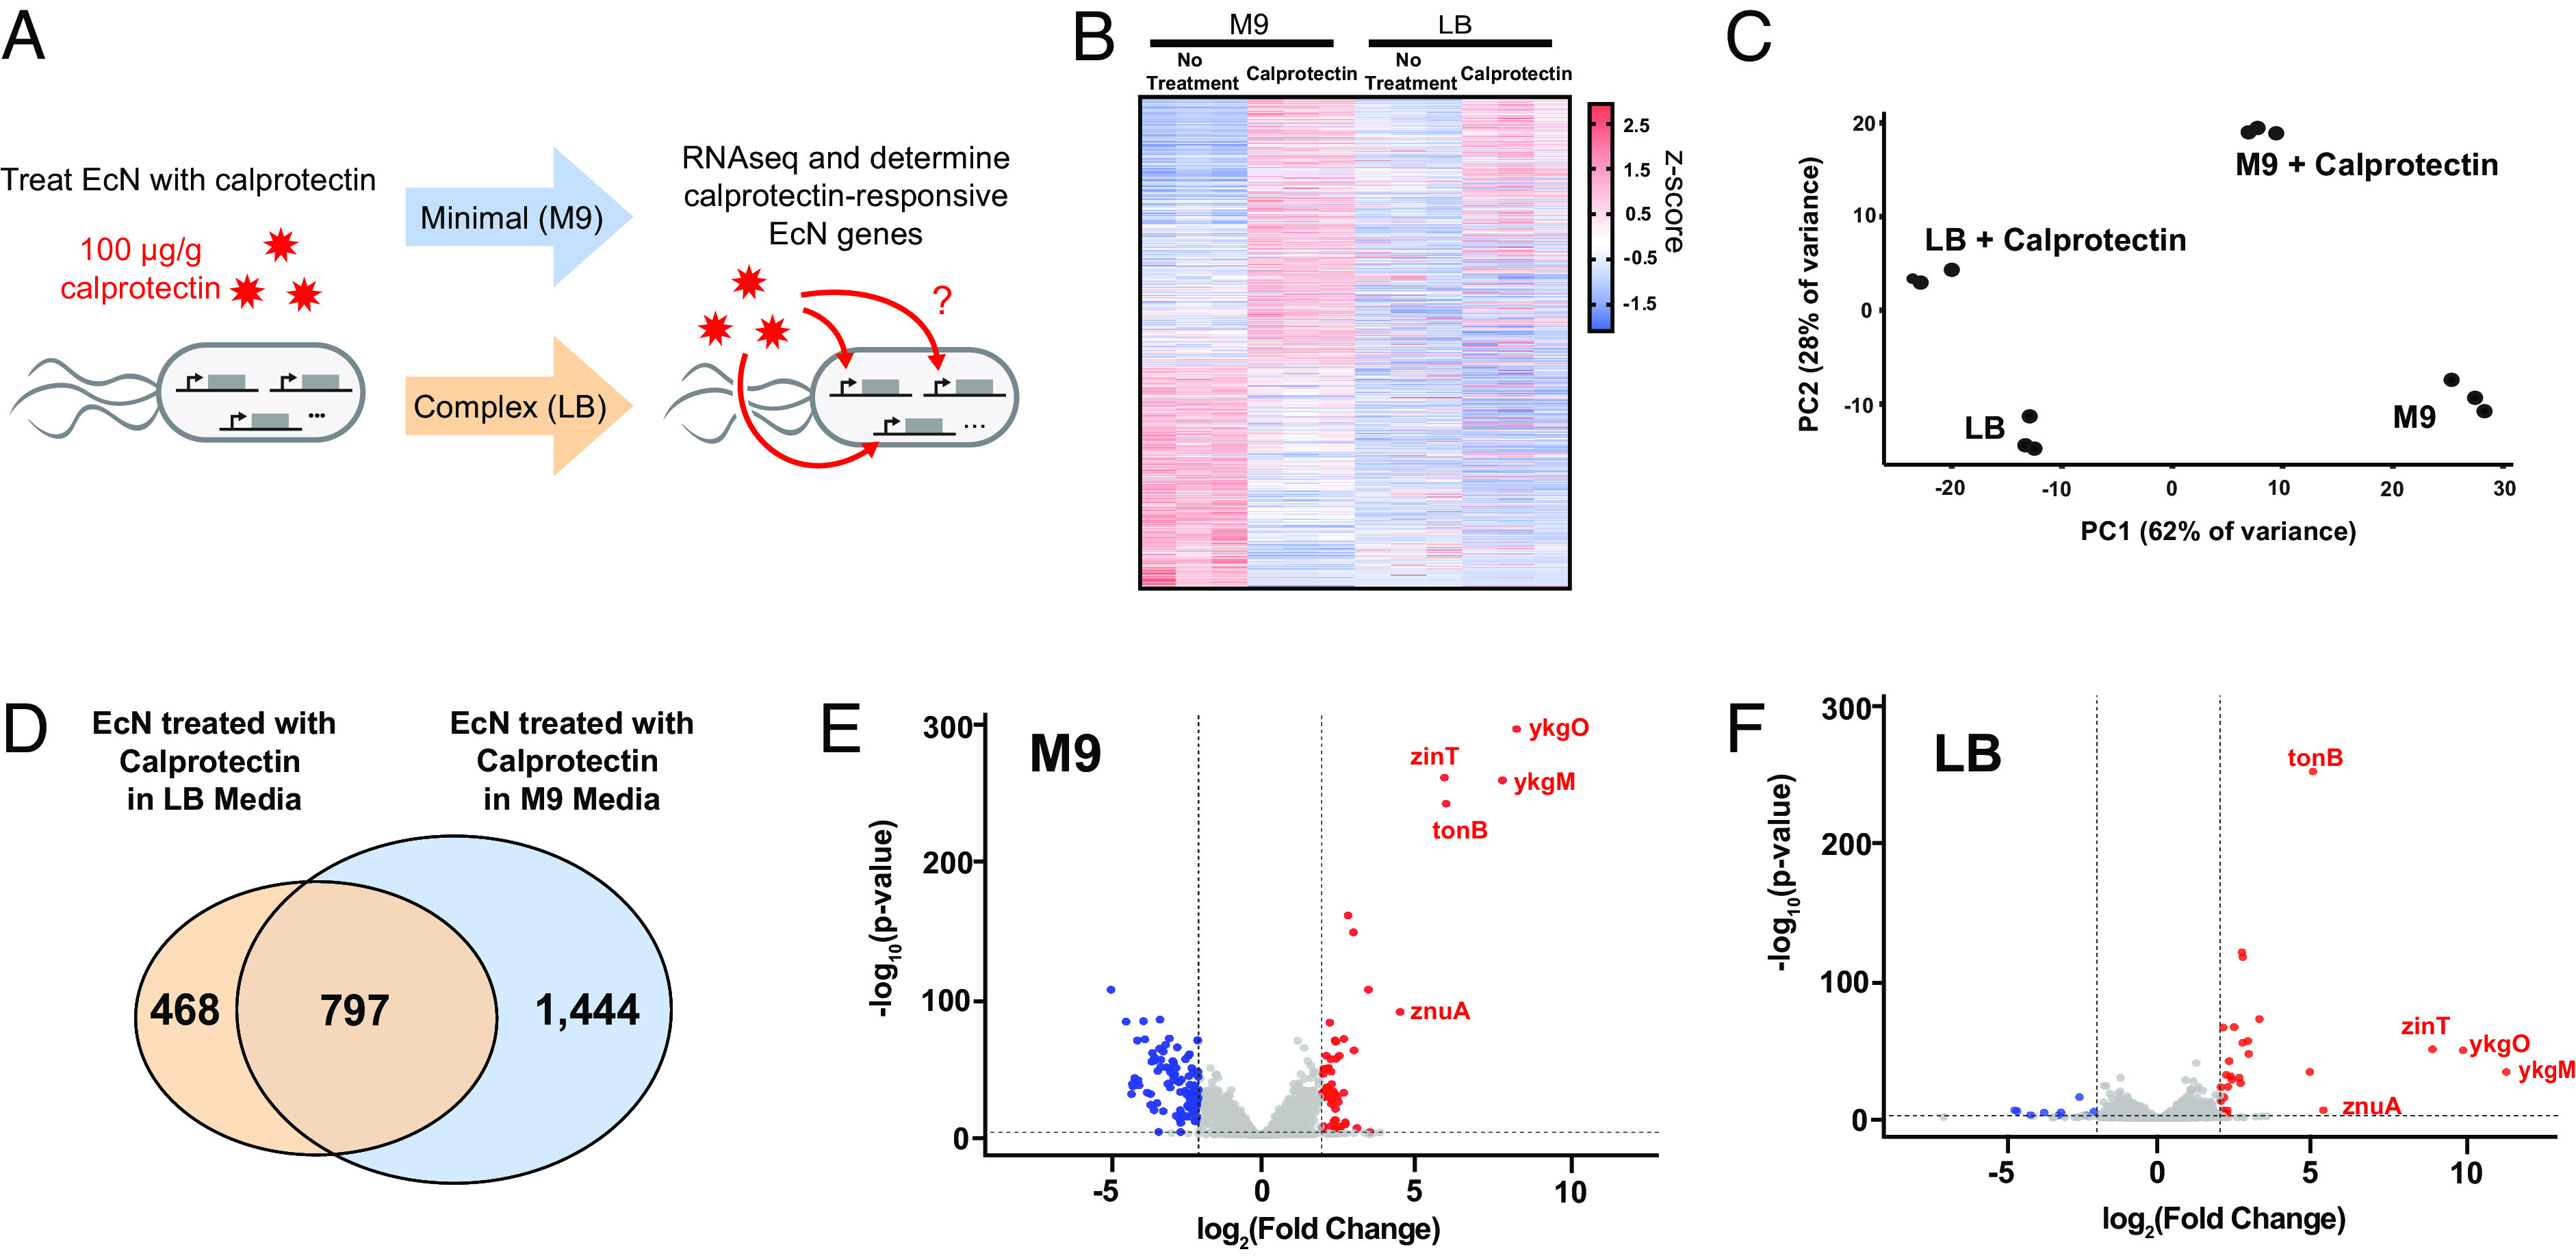
Fig. 1.

EcN show distinct gene expression changes in response to calprotectin. (A) RNA-seq was performed on EcN that were treated with calprotectin in either minimal (M9) or complex (LB) media. (B) Heat map showing all the significant (padj < 0.05) differentially expressed genes induced by calprotectin in EcN in both M9 and LB media (n = 3). (C) Principal component analysis performed on RNA-seq data (n = 3). (D) Venn diagram depicting overlap in statistically significant differentially expressed genes in EcN treated with calprotectin in LB and M9 media. (E and F) Volcano plot of all the significant (padj < 0.05) differentially expressed genes induced by calprotectin in EcN in both M9 and LB media.
